.svg)
.svg)


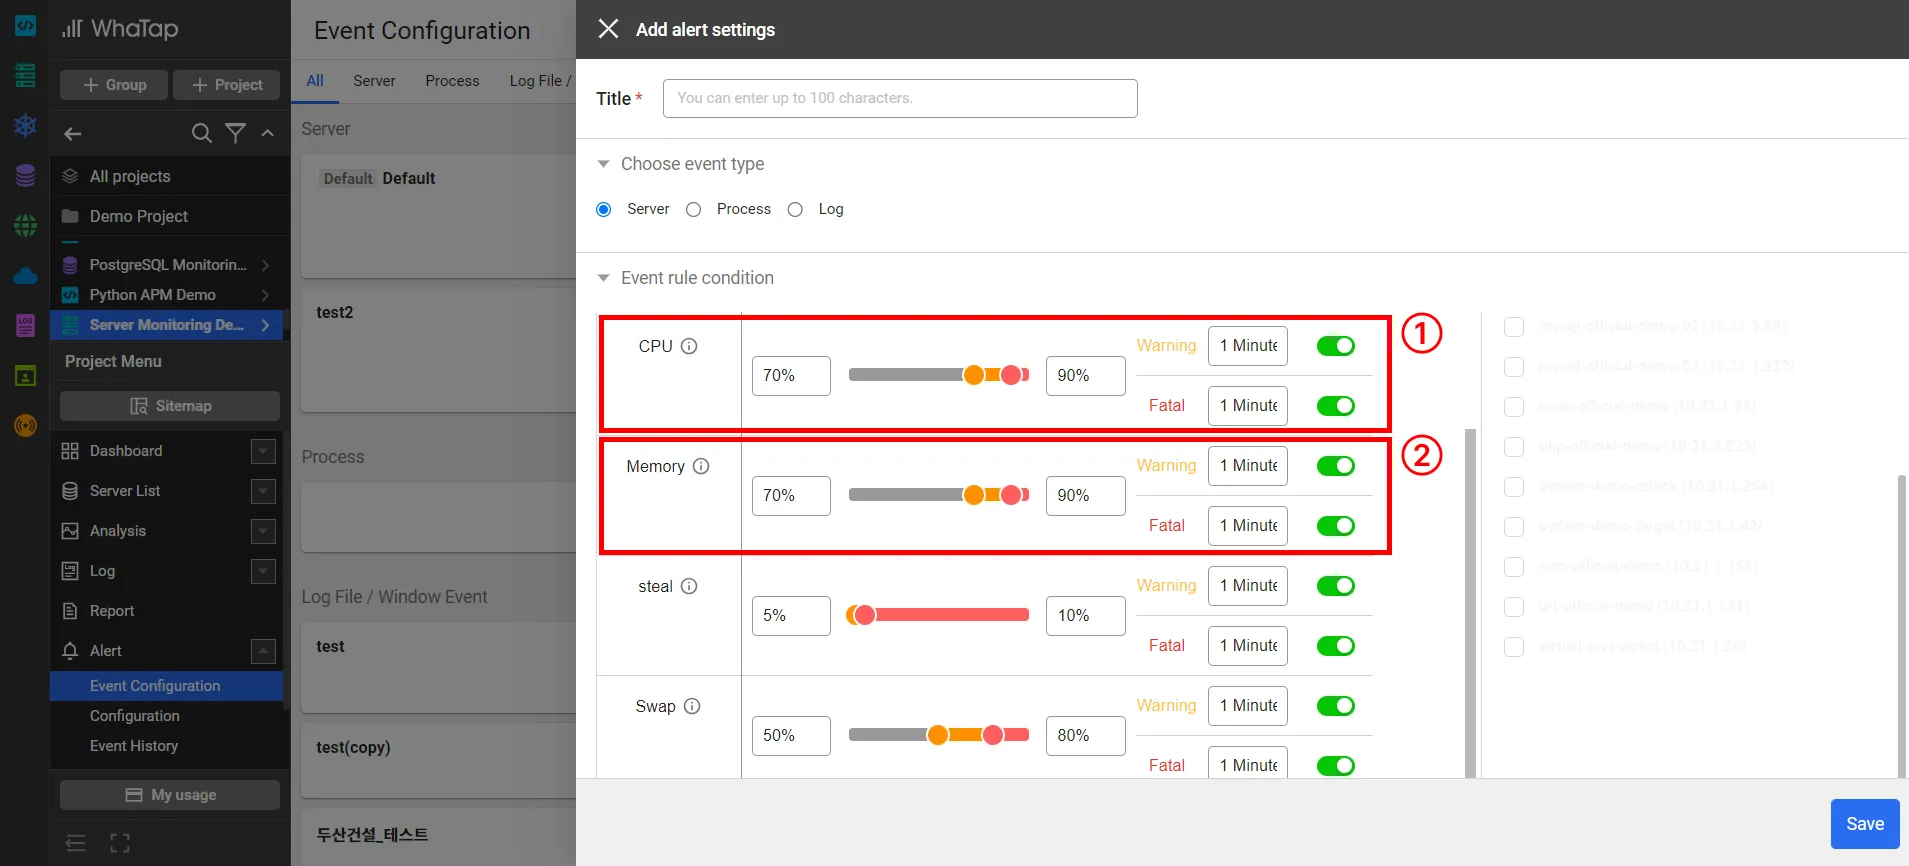
① WhaTap Service CPU Threshold Setting Screen② WhaTap Service Memory Threshold Setting Screen
1. CPU
CPU Performance Metrics are used as a measure of server performance. IT solutions often have pricing structures based on server performance, which is why they are often priced based on the number of CPU cores. As CPU utilization increases above a certain threshold, it begins to affect service, so thresholds should be set for all CPU values. Thresholds are typically divided into warning and critical levels, with warnings being used to detect potential problems in the future and critical levels being set based on the need for immediate action. Problems can be solved by purchasing additional hardware or adjusting the performance of applications that use the CPU.
Many often find themselves contemplating how to set threshold values, and this is something that needs to be learned through actual operations. I'd like to introduce a reference article. What makes a system well-operated?
2. Memory
Monitoring memory allows you to receive notifications when the server's memory usage exceeds a threshold. The detailed classification of memory can vary depending on the operating system, but in general, the memory usage is checked including buffer and cache memory. If memory is being consumed too rapidly or the usage remains consistently high, it is important to devise strategies to address these issues.
In WhaTap's server monitoring, you can set threshold values for both memory usage and SWAP memory usage. In general, it is recommended that SWAP memory is not used more than 50%. However, this may vary depending on the system configuration.
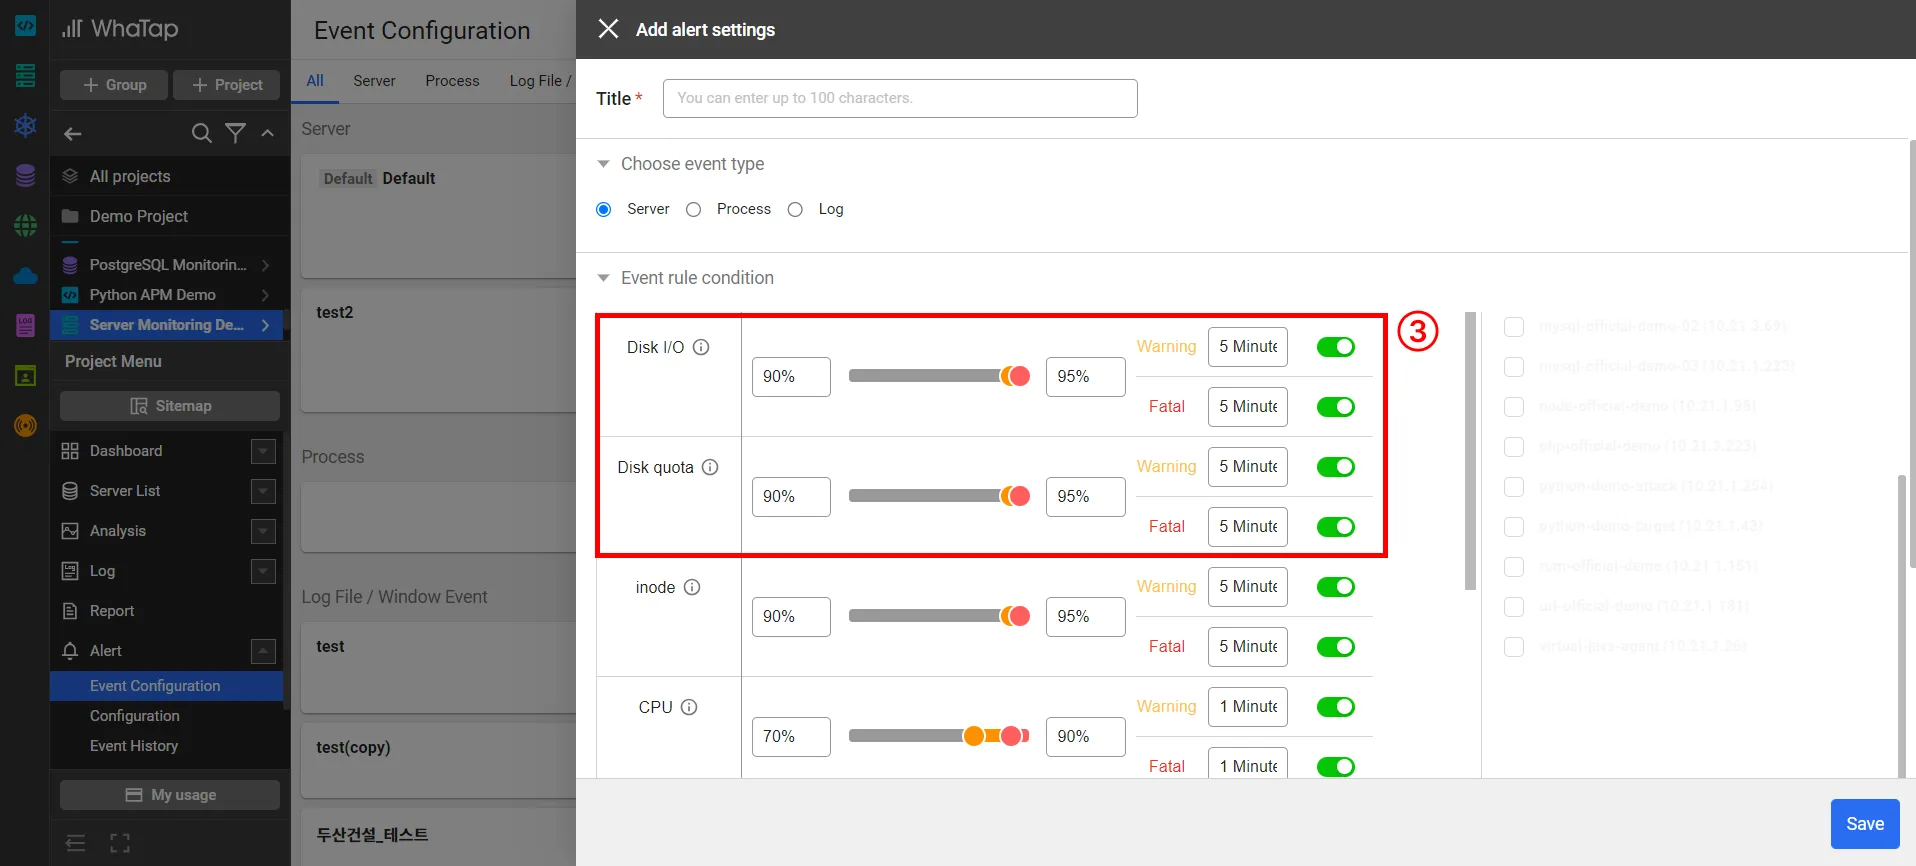
3. Disk I/O & Disk Usage
Monitoring Disk I/O is a crucial element, especially when utilizing network drives. It involves tracking metrics such as reading speed, writing speed, queue, and ratio of wait time of the disk.
In disk usage monitoring, you can receive notifications when the system's hard drive usage reaches a critical value by setting a threshold for disk usage. If disk space runs out, it can lead to critical issues such as application errors, data loss, and service outages.
In WhaTap, you can set thresholds for Disk I/O's busy time (the ratio of waiting time, Disk I/O) and Disk usgase (Disk quota). These simple settings allow you to manage metrics related to key performance indicators.
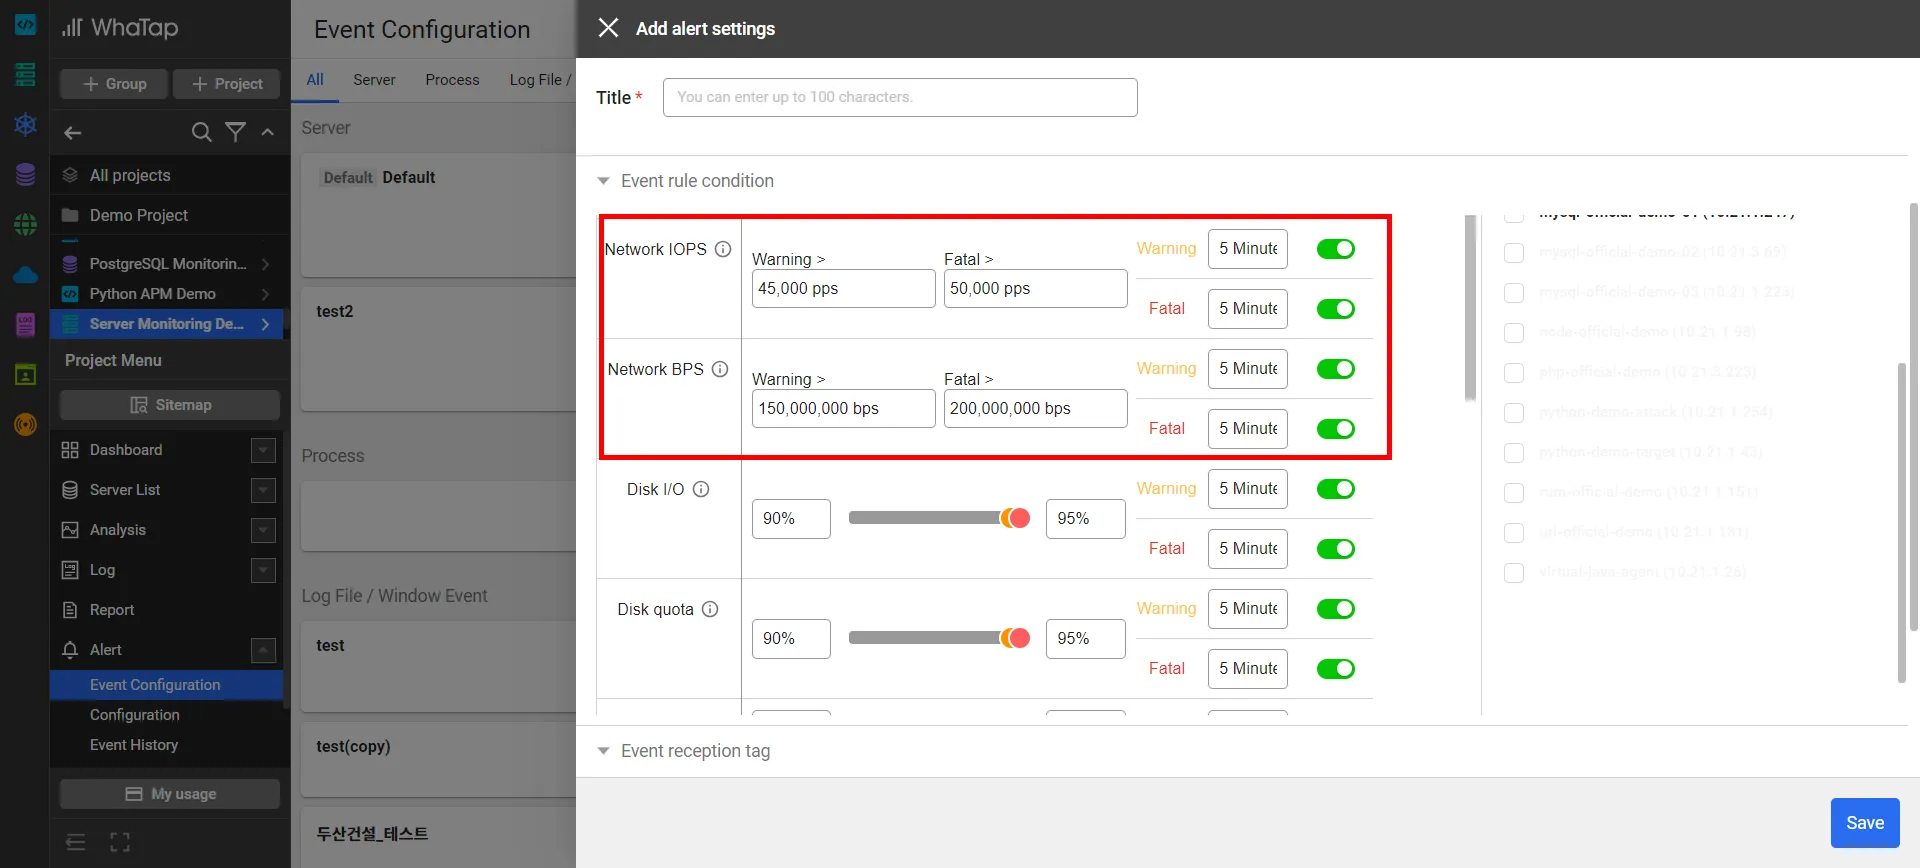
4. Network
In network monitoring, you can monitor the input and output traffic speed and error packets of network interfaces Problems that occur in the network can be challenging to identify and may become increasingly difficult to prove over time.
WhaTap allows you to set a threshold for the total input and output traffic, which is a convenience measure aimed at maximizing usability. Both traffic and Packet Per Second (PPS) are used to check for excessive input and output from external sources.
Conclusion
In addition to process monitoring, log monitoring, and event monitoring, which help in operating servers and troubleshooting. If the situation truly demands focusing solely on development, it's recommended to establish a monitoring system to routinely check these four elements.


