.svg)
.svg)


In the early stages, many startups are not concerned about performance. It's understandable as they are busy creating their product, and the significance of performance might not be immediately apparent. If there is a sudden surge in users, services like Amazon Auto Scaling can address that issue. Yes, for startups aiming to quickly demonstrate value, there may not be a need to focus on performance in the initial stages of the service.
However, when the monthly cost of Amazon services exceeds ten million Korean won, it gradually prompts us to contemplate whether our service is utilizing infrastructure reasonably. We also start to desire establishing a foundation for infrastructure costs. If you want to check the performance metrics of the system, now is the time to do so when looking at TPS indicators.
TPS Calculation
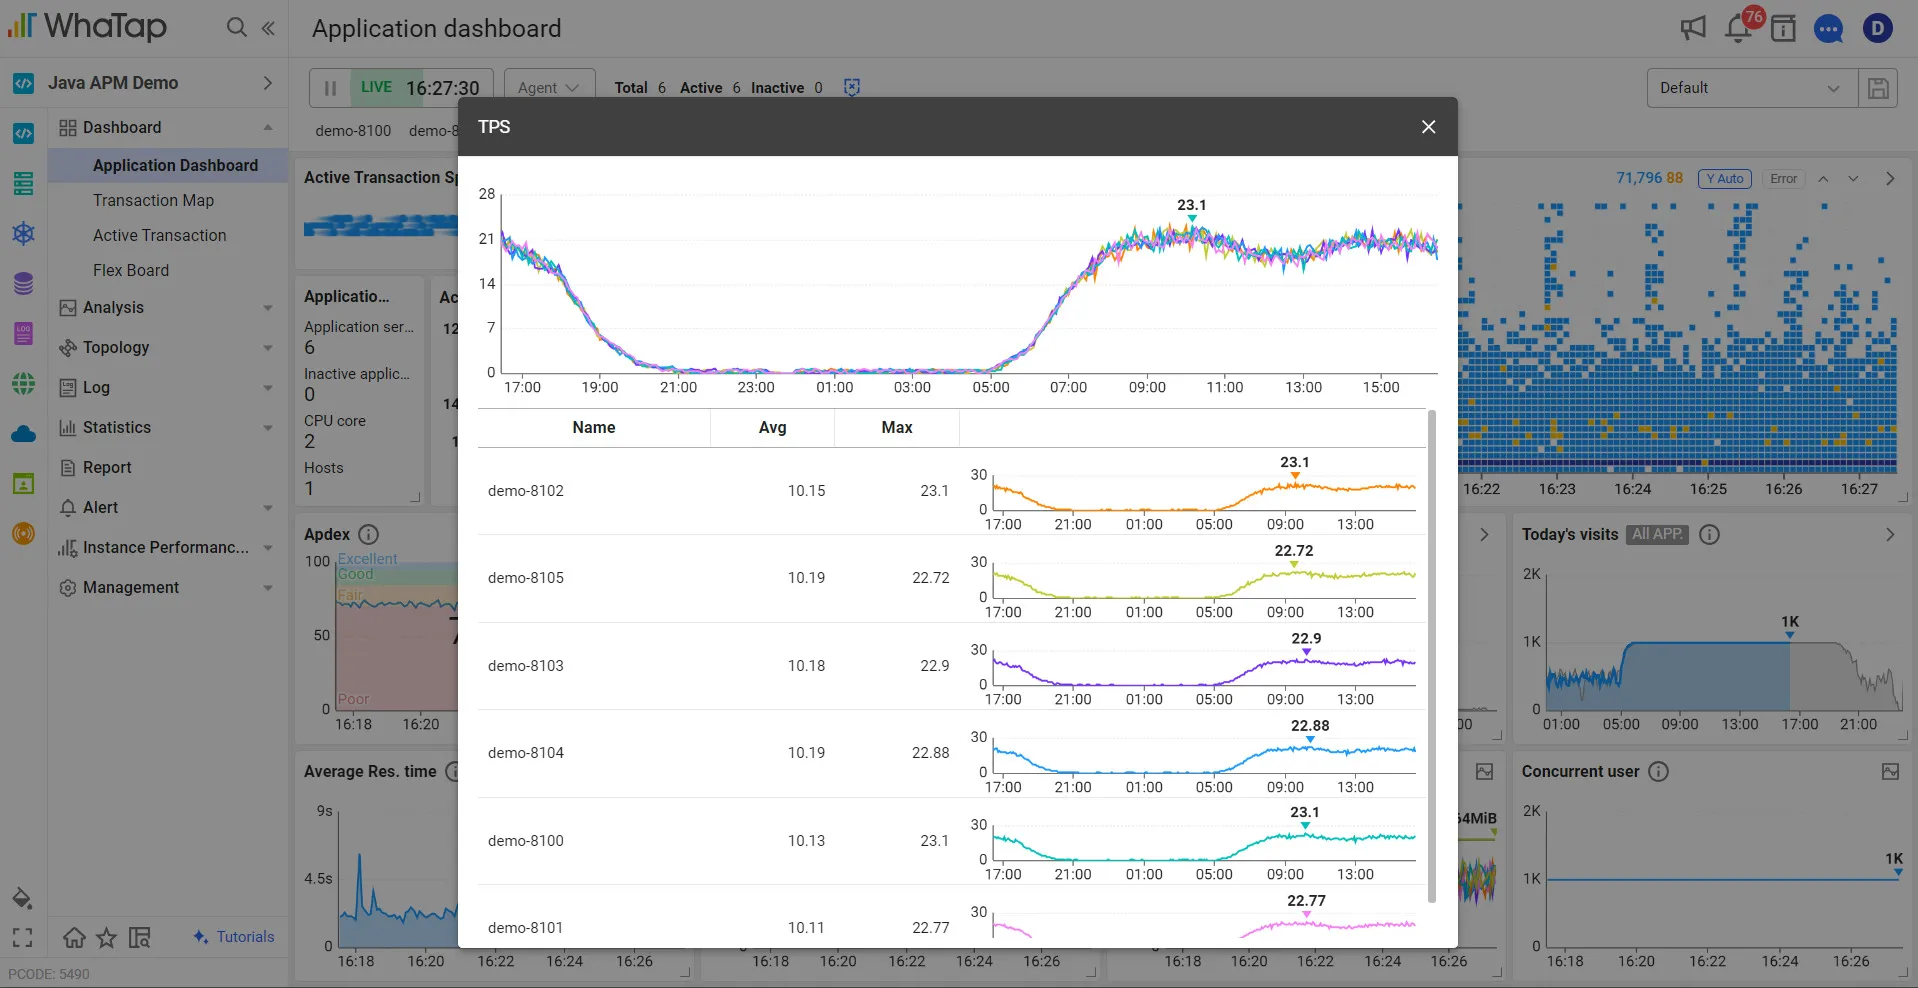
Transaction Per Second (TPS) represents the number of transactions processed per second. The actual calculation involves determining the number of transactions executed over a specific period and then converting it to a value per second. In the case of WhaTap, as values are collected over a 5-second interval, the displayed value is obtained by dividing the aggregated number of transactions over the unit time by 5.
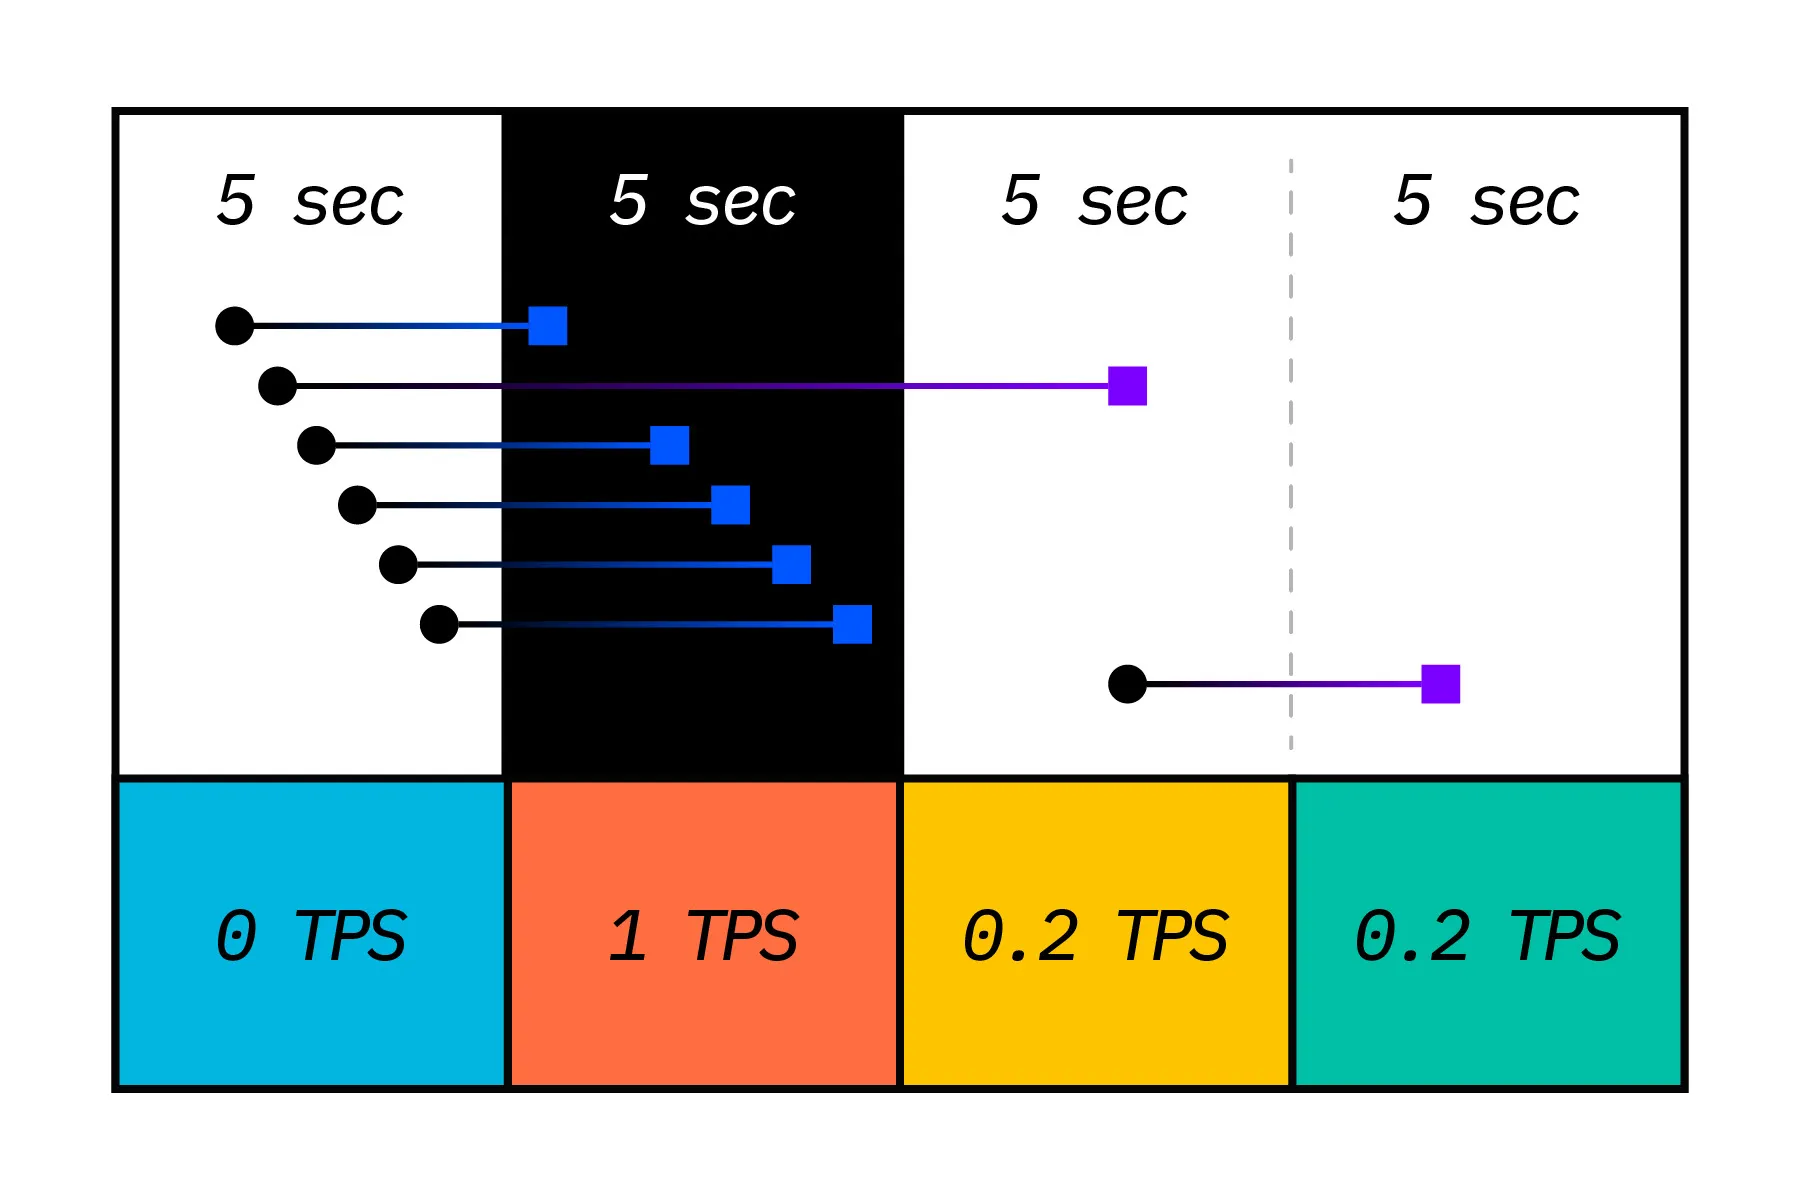
In the second column of the above diagram, you can observe that 5 transactions have been successfully executed. In such a scenario, the method to calculate TPS is to divide the number of transactions (5) by the time duration (5 seconds), resulting in a value of 1 TPS. (WhaTap's TPS metrics involve a more complex calculation. WATAP displays a 30-second average TPS at 5-second intervals to illustrate the trend in the chart.)
Saturation Point and Low TPS Reasons
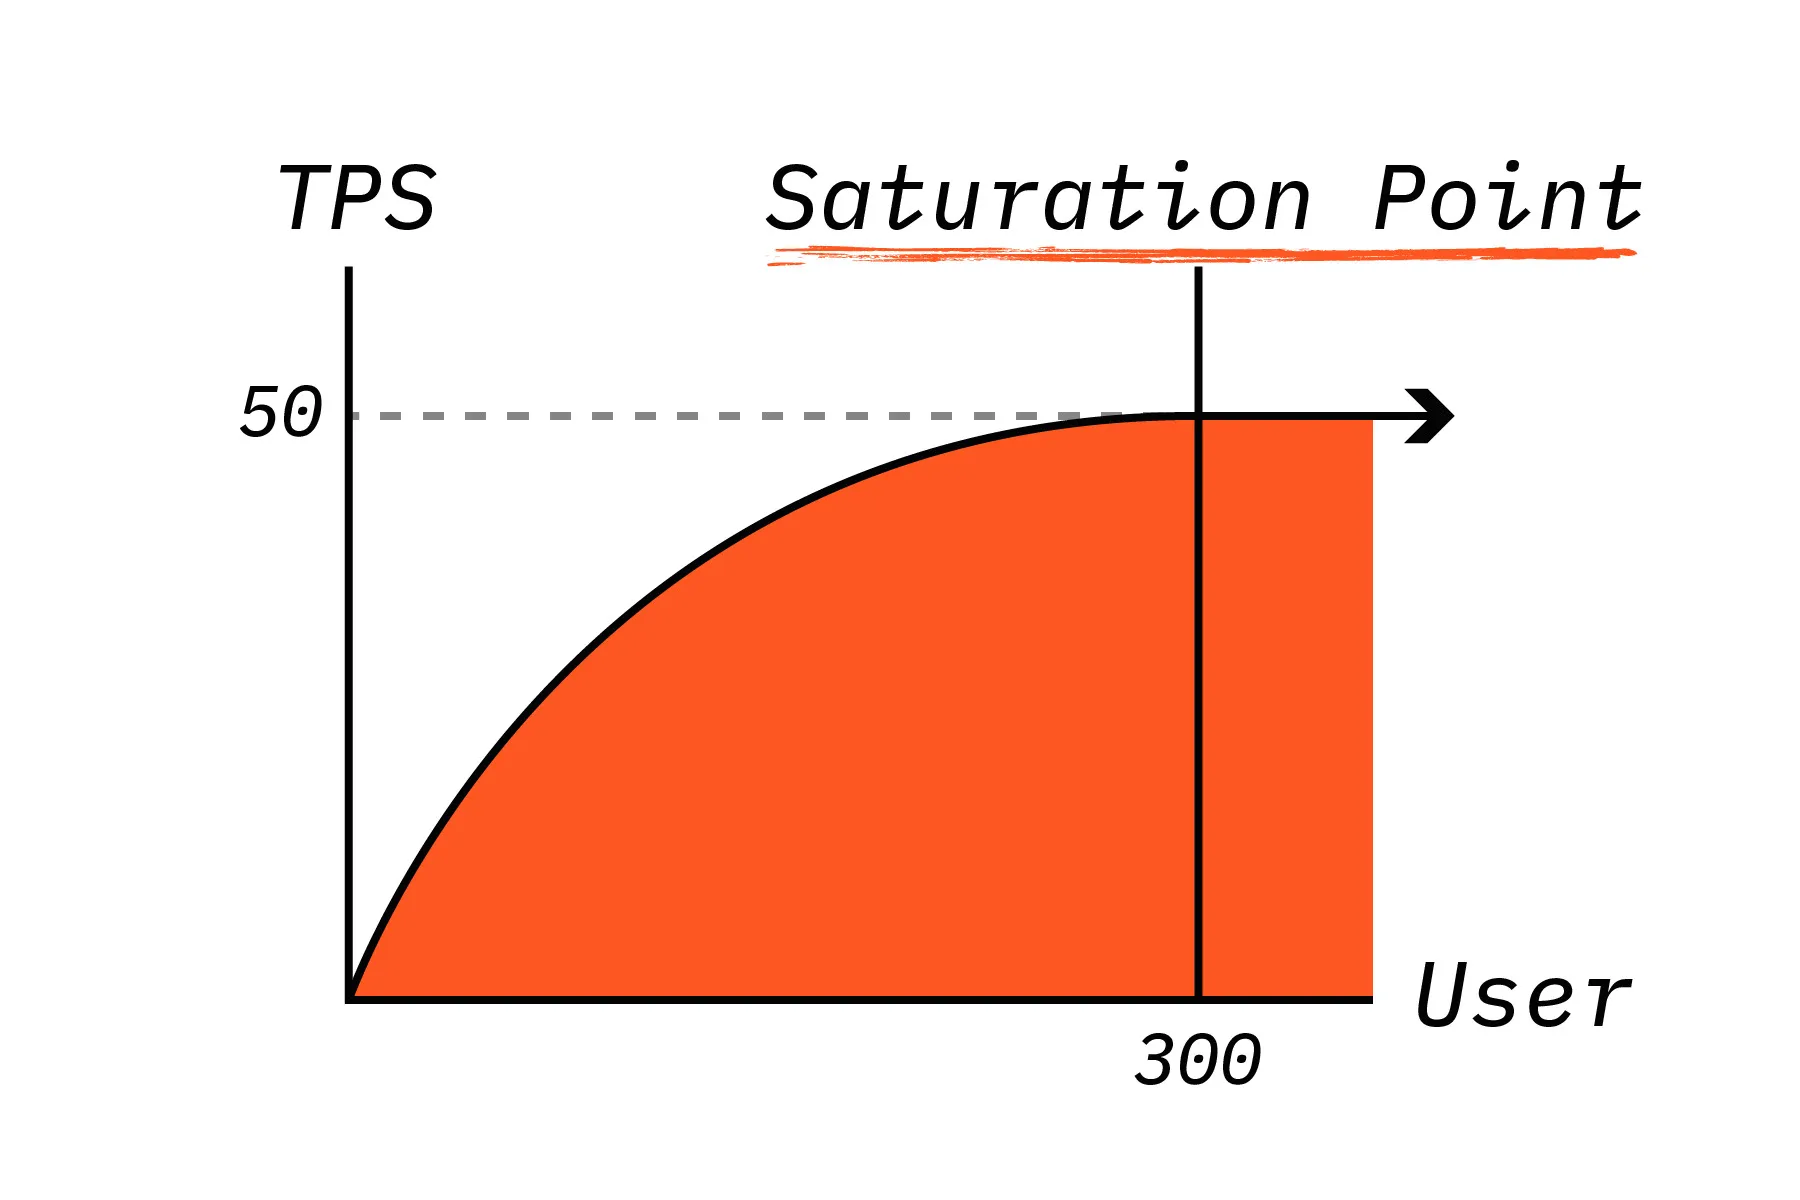
As the user base steadily grows within a service, there comes a point where the Transaction Per Second (TPS) ceases to increase. This situation is termed the Saturation Point. The diagram above illustrates an ideal scenario for the service. However, in instances where the service is not properly tuned, crossing the Saturation Point may result in a decline in TPS. From the provided context, one can anticipate that once the service's user count surpasses 300, the TPS becomes fixed, leading to a relatively longer response time for transactions.
Expanding on the narrative, based on the provided diagram, when concurrent users exceed 300, the Transaction Per Second (TPS) plateaus, indicating that the service's stagnation period is likely to commence. If, for instance, the TPS for 300 concurrent requests is 50, one could estimate that it takes approximately 6 seconds to process each request. By preemptively assessing TPS and concurrent users in this manner, one can envision the performance characteristics of the service.
Summary of TPS
- TPS refers to the number of transactions processed per second.
- TPS serves as a benchmark for service performance.
- Regularly check TPS metrics. Use TPS to identify peak times, such as specific days or hours when the maximum is reached.
- The point at which TPS no longer increases is referred to as the Saturation Point.
- Beyond the Saturation Point, if users surge, TPS remains fixed, resulting in longer response times.


