
Monitoring means to watch and observe something, and the purpose of monitoring is to check and prepare for the status, availability, changes, etc. of the target through continuous surveillance and supervision. In other words, it can be said that "to continuously monitor and observe the status or situation of something to prepare for and overcome unexpected situations and errors". Especially in the field of IT services, since services are basically planned in advance and provided with limited costs and resources, the importance of monitoring cannot be low in IT services that emphasize user experience no matter what environment the service is operated in. Especially in cloud platforms with scalability and flexibility, it is even more important because it is necessary to quickly decide to scale up or down the system based on the data collected through continuous monitoring.
Let's take a look at what important indicators and data records are provided by focusing on the meaning of monitoring, which is "to continuously monitor and observe the status or situation of something to prepare for and overcome unexpected situations and errors."
Monitoring Target
Groups
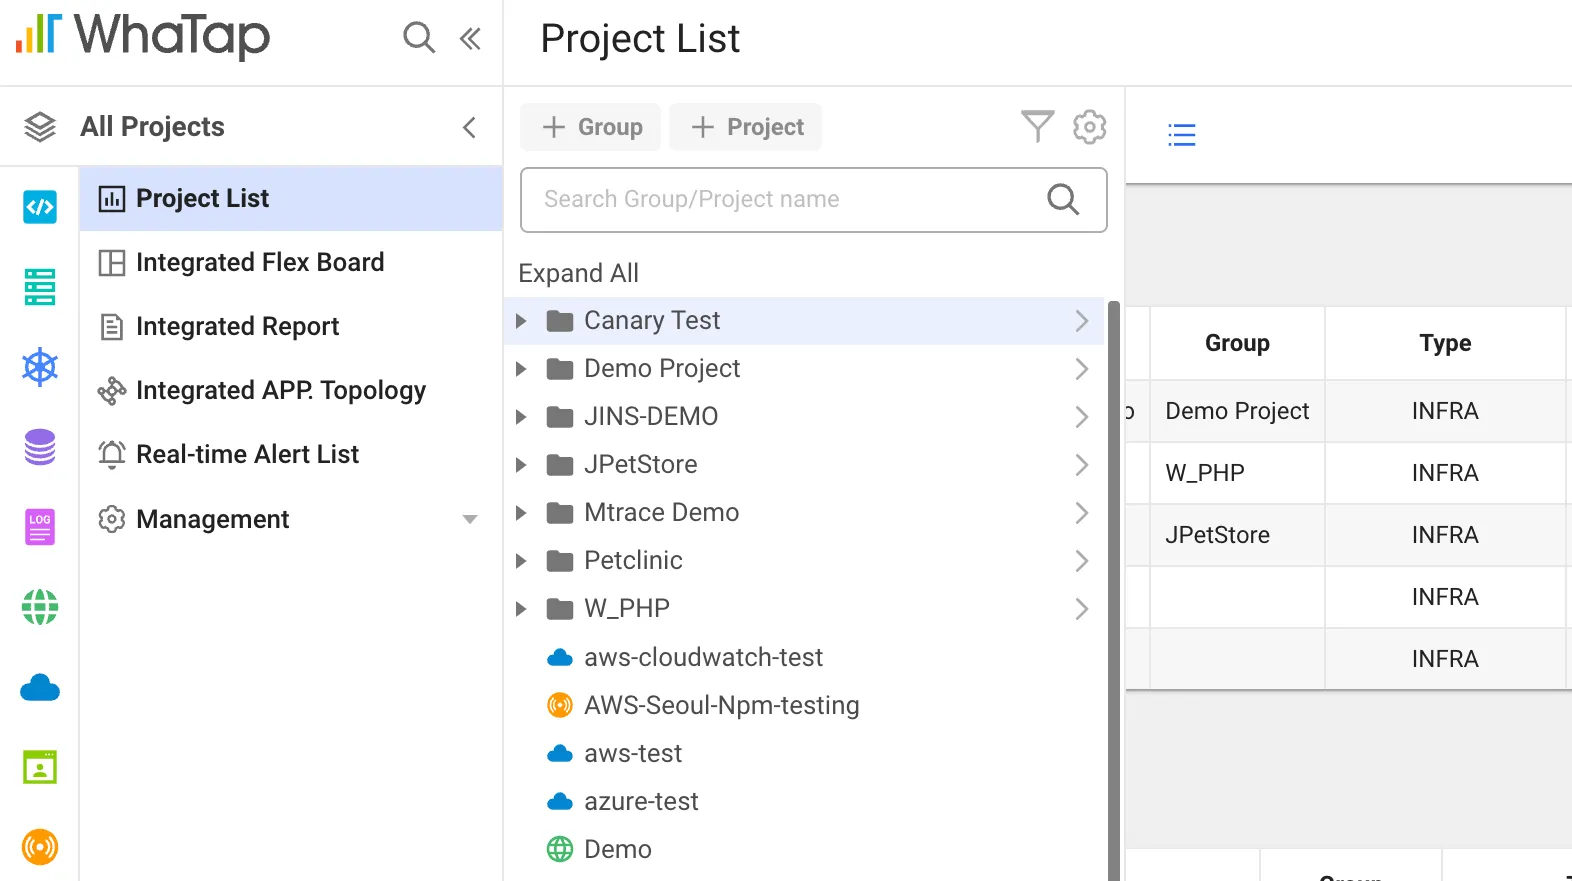
Projects created in groups
In WhaTap, you can group monitoring targets. In a large-scale distributed processing system, it can be difficult to organize and distinguish monitoring in a complex distributed processing system due to the increase in service scale, but WhaTap provides a structure where you can create groups and create multiple projects to register the desired monitoring targets. You can also share groups by inviting other users to join the desired group, and you can set authorizations to limit project modification rights.
Project
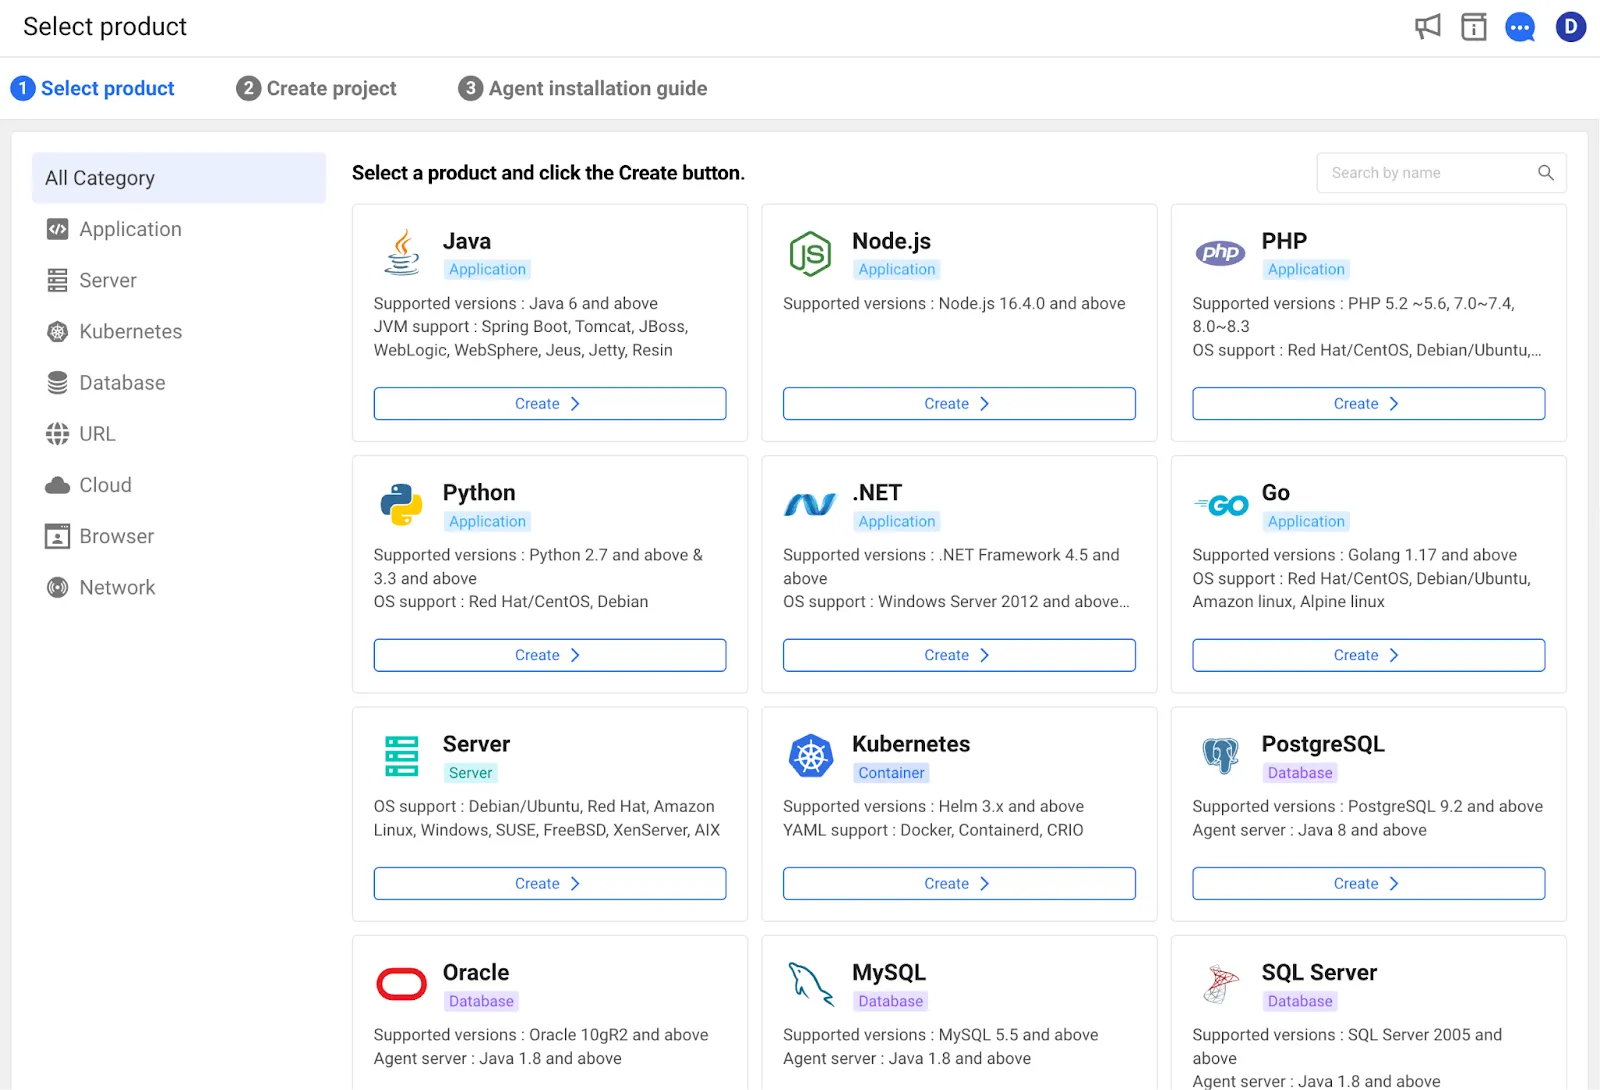
Project types to choose from when creating a project
When you create a project, it is assigned a unique project code (PCODE), which is a number that identifies the project. There are a total of 12 project types to choose from when creating a project, and except for URL type, you can create more than one project of the same type. You can register targets of each type to the desired project. For example, if you create a project of java type named 'myServer', you can register multiple java-based WAS servers in this project. You can also specify the geographical location (region) of the WhaTap collection servers that collect monitoring data when creating a project (e.g., Seoul, Tokyo, etc.).
Settings
After you create and enter a project, you will find the agent installation files and instructions for installing the agent for the server or application you want to monitor. Get an agent license from the project and follow the manual to set it up. Based on the license, the target finds the project to which it belongs. More information about the server or application to be monitored and how to set it up is detailed in the WhaTap guide.
Keeping tabs on the health and status of your targets
As the first thing users see in your monitoring, your dashboard should answer their basic questions and present decisive data in intuitive metrics. It should also be able to continuously show changes in the target's situation when showing data coming from multiple servers.
Dashboards in server monitoring
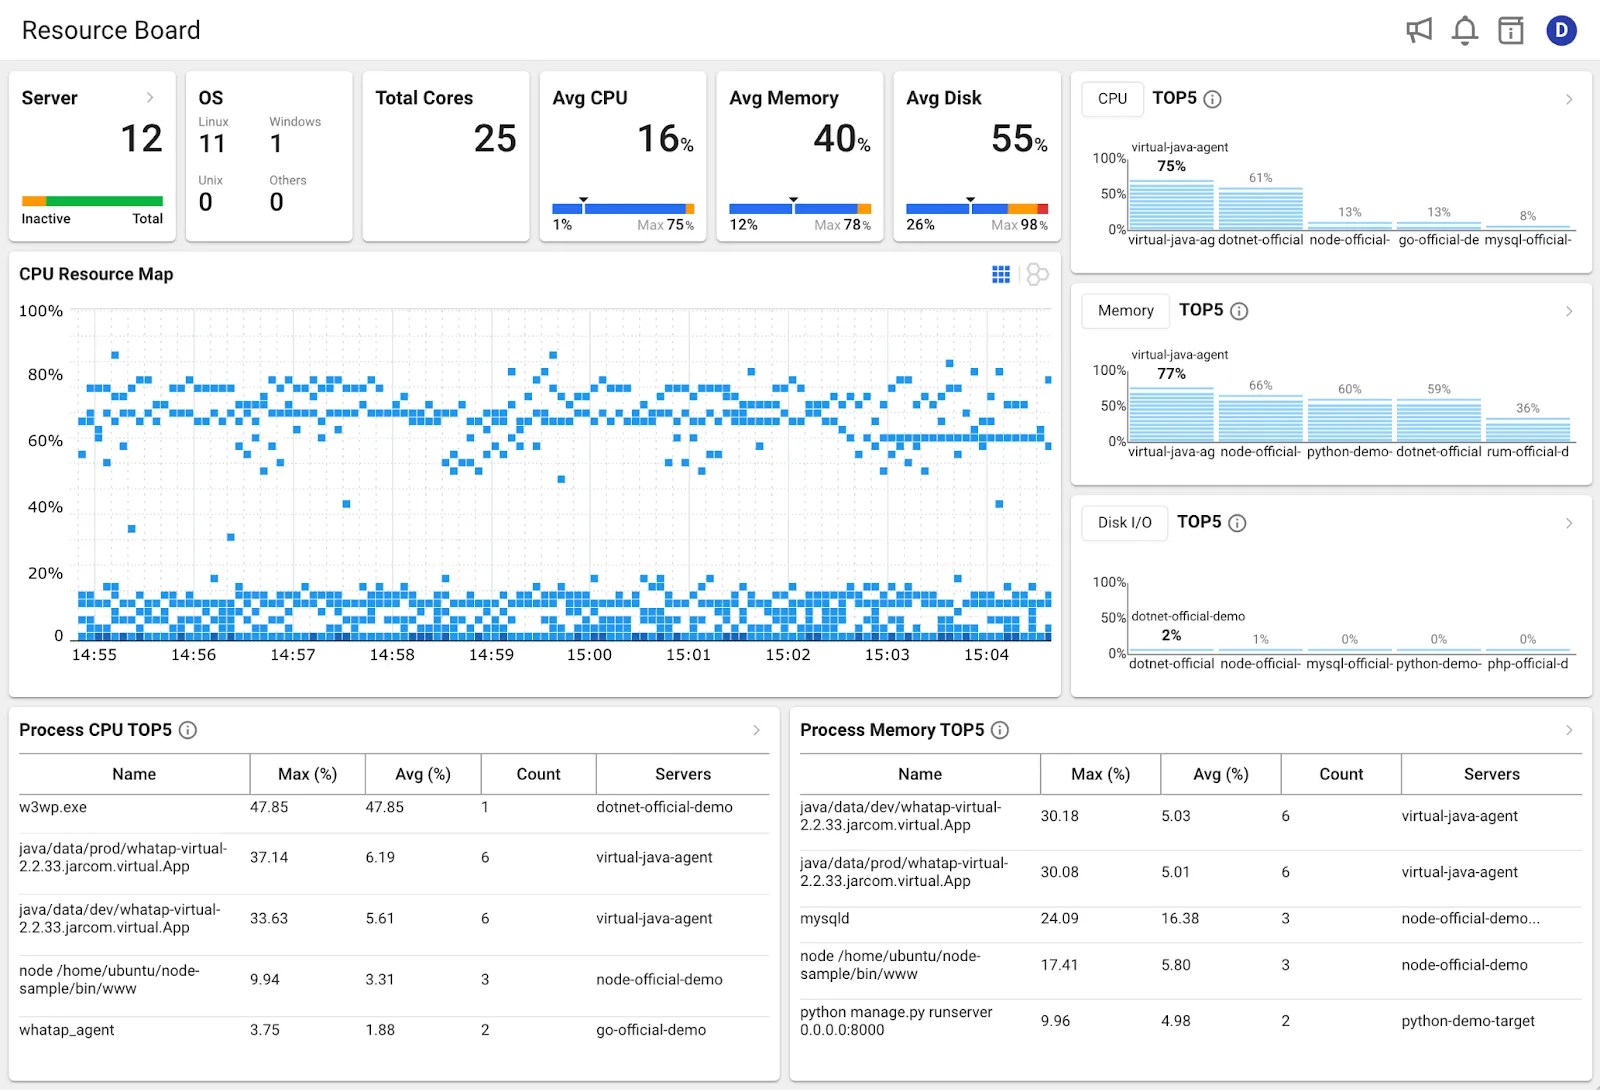
WhaTap Server Monitoring Dashboard
The dashboard for server monitoring shows metrics about the most important resources for server monitoring: CPU, memory, and disk. It continuously shows the total number of servers registered to the project, the total number of cores, and the average resource usage. It shows the five most resource-intensive processes in order, showing which processes on which servers are taking up the most CPU and memory. It also shows the five most recent events that occurred in your project based on the event policies you set.
As the centerpiece of the dashboard, the CPU resource map takes up the largest screen in the dashboard. It is an intuitive metric that gives you an immediate view of the health of your servers. The horizontal axis is time and the vertical axis is CPU utilization. It shows the change in CPU utilization over the last 10 minutes, and the data is continuously refreshed in 5-second intervals. If a particular cell is darker, it means that there were more servers with that utilization at that time. This way, you can quickly see how saturated your servers are by just looking at the entire resource map. If you want, you can also drag with your mouse to see the details and metrics of the servers in a specific area.
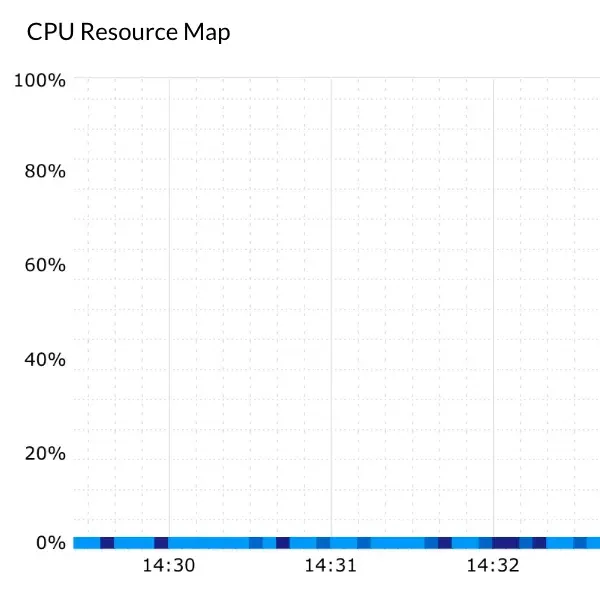
Stable but with few system requests or excessive performance
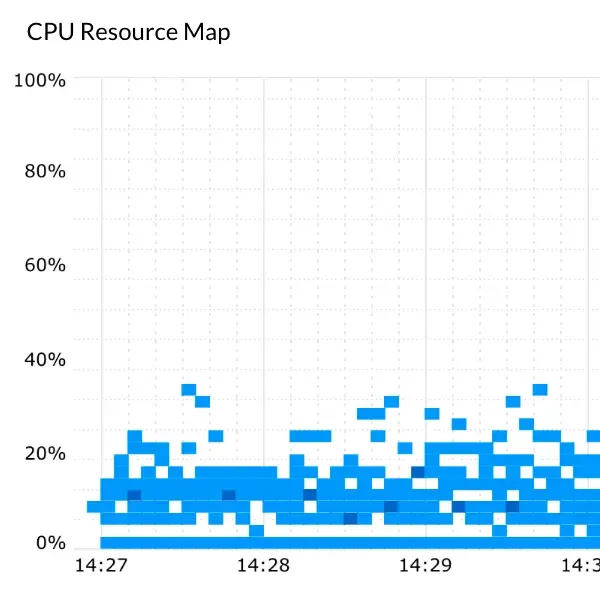
Having a system that is ready for the load
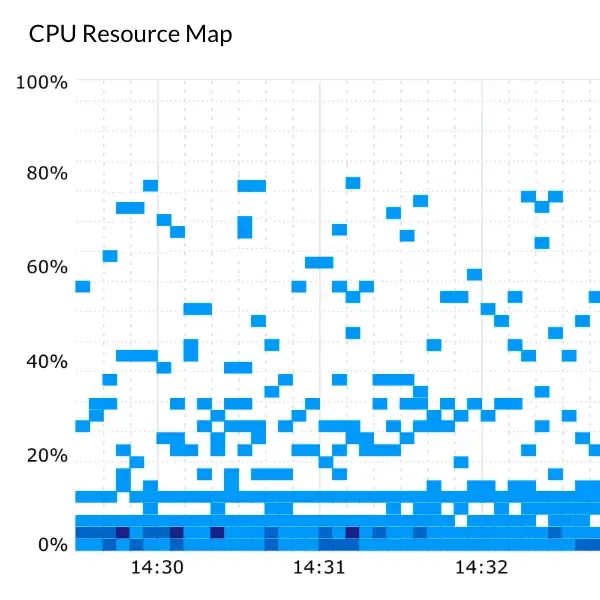
Health of systems using cloud platforms
If you see a lot of cells with less than 5% occupancy in the last 10 minutes, it means that the servers are getting less CPU throughput. On the other hand, if the cells are consistently close to 100% occupancy, it means that a particular server or multiple servers are saturated and may be experiencing response delays, requiring engineer intervention.
If needed, you can view specific data for CPU, Disk, and Network on the 'View Server Details' page in your project. You can learn more in the Server Monitoring Service Guide.
Detailed analysis of JAVA application monitoring
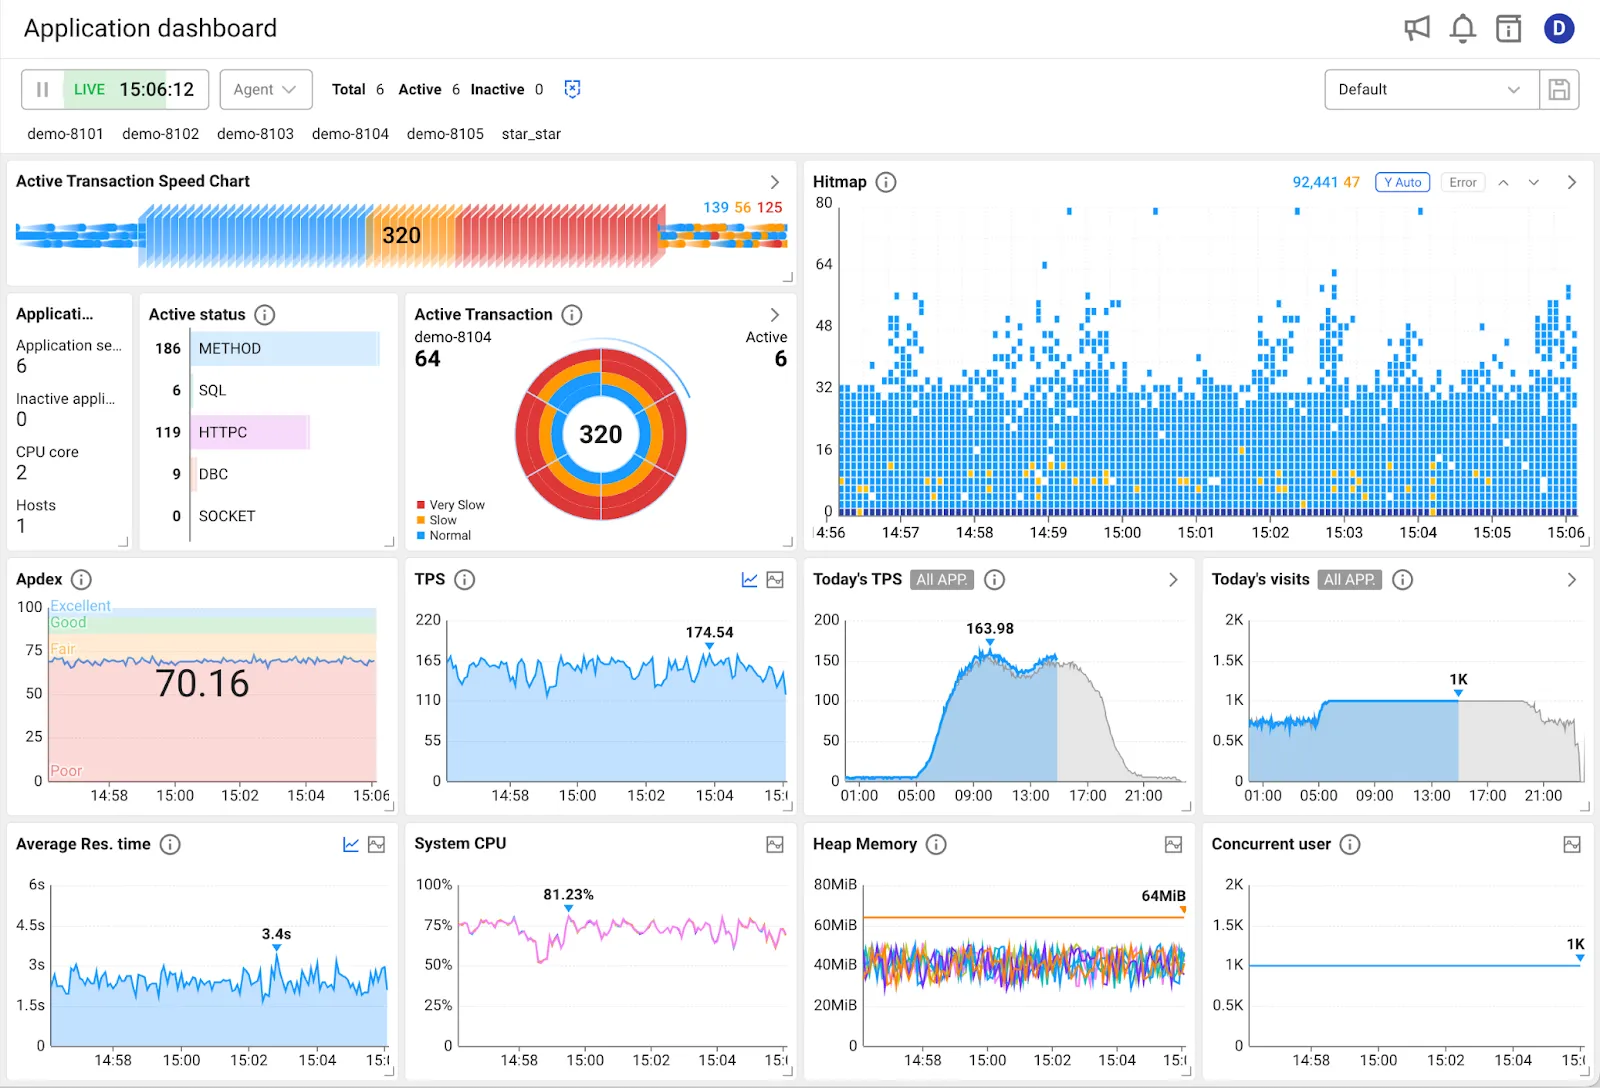
WhaTap Java application dashboard
Application Monitoring's dashboards are also organized to give you an intuitive view of the metrics you need to know, giving you a complete picture of your system. Application Monitoring provides profiles to quickly analyze errors or delays in your metrics when they occur. For example, if you drag a cell in the heatmap that is colored orange or on a line with excessively high processing time, you will be taken to the heatmap transactions page where you can view the profile.
The time between a client's request being received by the server, processed, and sent back to the client is called a transaction. The transaction process is complex and not easy to analyze because it involves connecting to the database, waiting for a database request, API requests, internal methods or processing, and interfacing with other transactions. When something unexpected happens in the process, such as the request time of a transaction taking too long in a certain section or failing, you need to see detailed information to analyze it accurately. There are also complex situations where a transaction is transferred to another server and its processing needs to be analyzed as well.
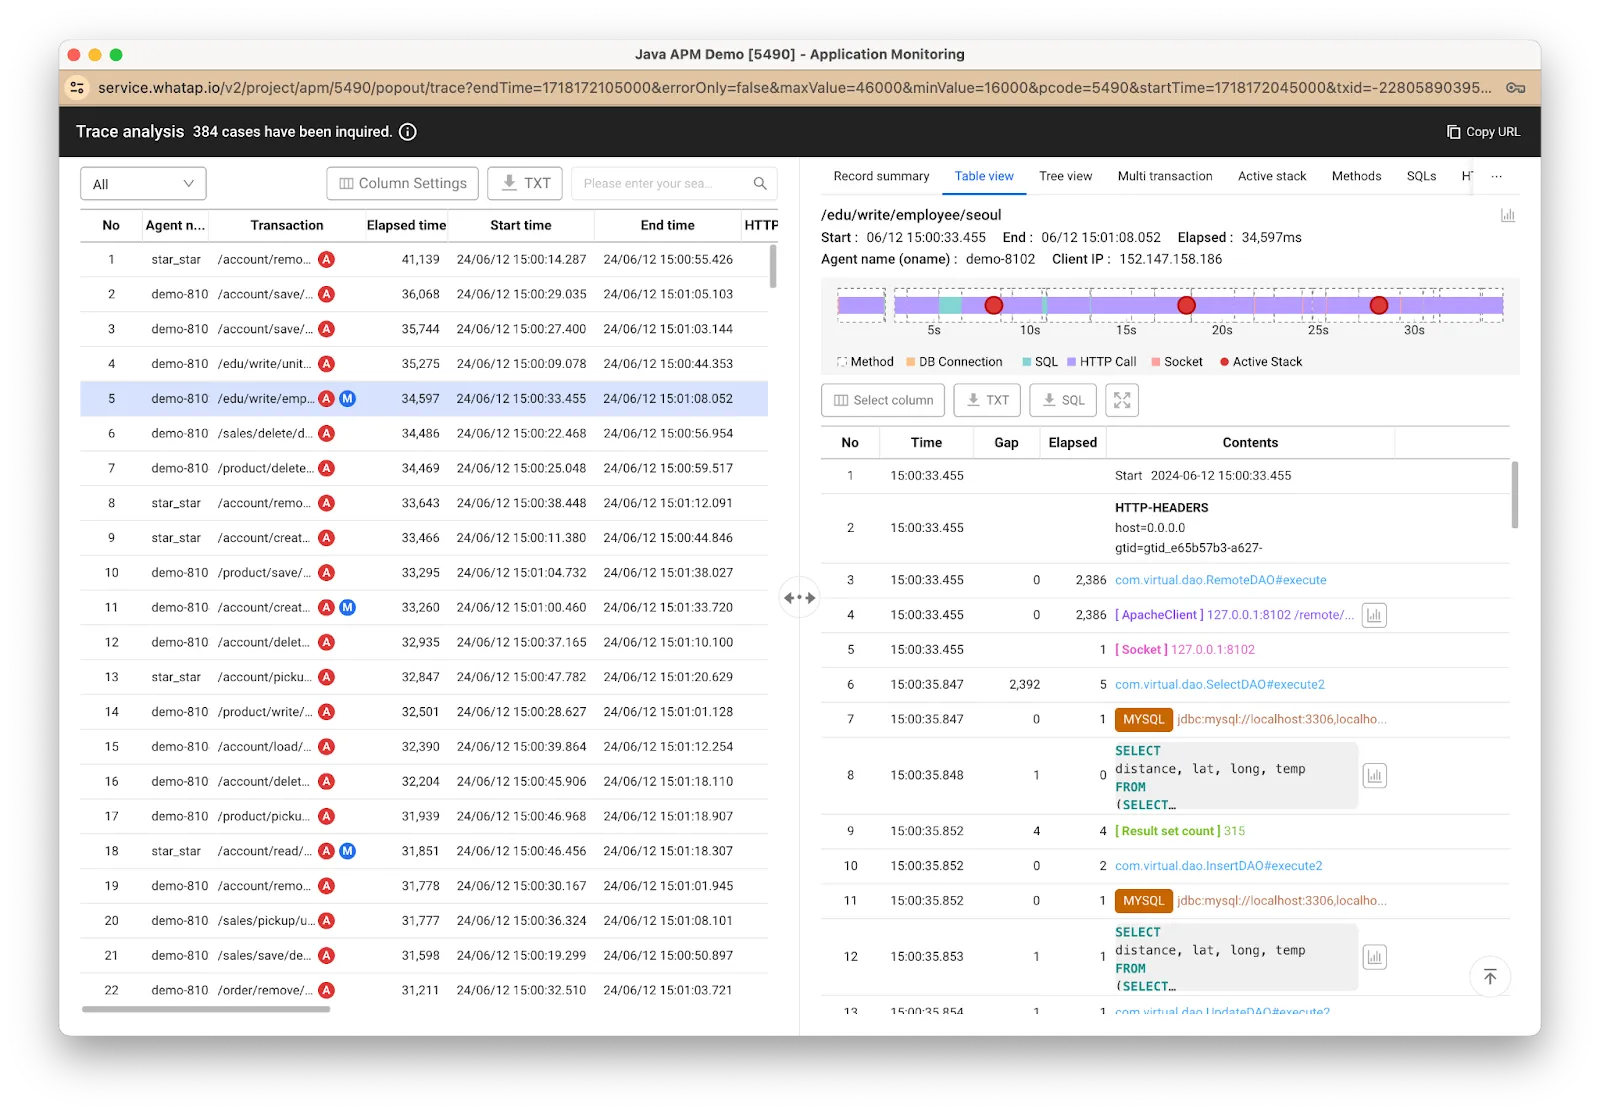
Transaction detail page
In this tab, you can view detailed information from the client information to the time spent on the server to process the request, SQL processing time, query information, and more, as shown in the image above. You can also view the history of function calls with the "active stack" or the transition of processing with multi-transactions. This information provides a baseline of key metrics to help you catch errors quickly and improve performance.
You can learn more about what data you can specifically see in application monitoring in the Application Monitoring Service Guide.
Prepare for and overcome unexpected situations and errors
Unexpected situations and errors need to be notified to engineers in a variety of ways, and they need to be overcome by human intervention or automation. However, because the services being monitored vary, the thresholds set for each service will vary, and the criticality of the error that must be notified to engineers will vary. On top of that, too many frequent calls can lead to engineer fatigue and a situation where they get used to it and ignore even important alerts.
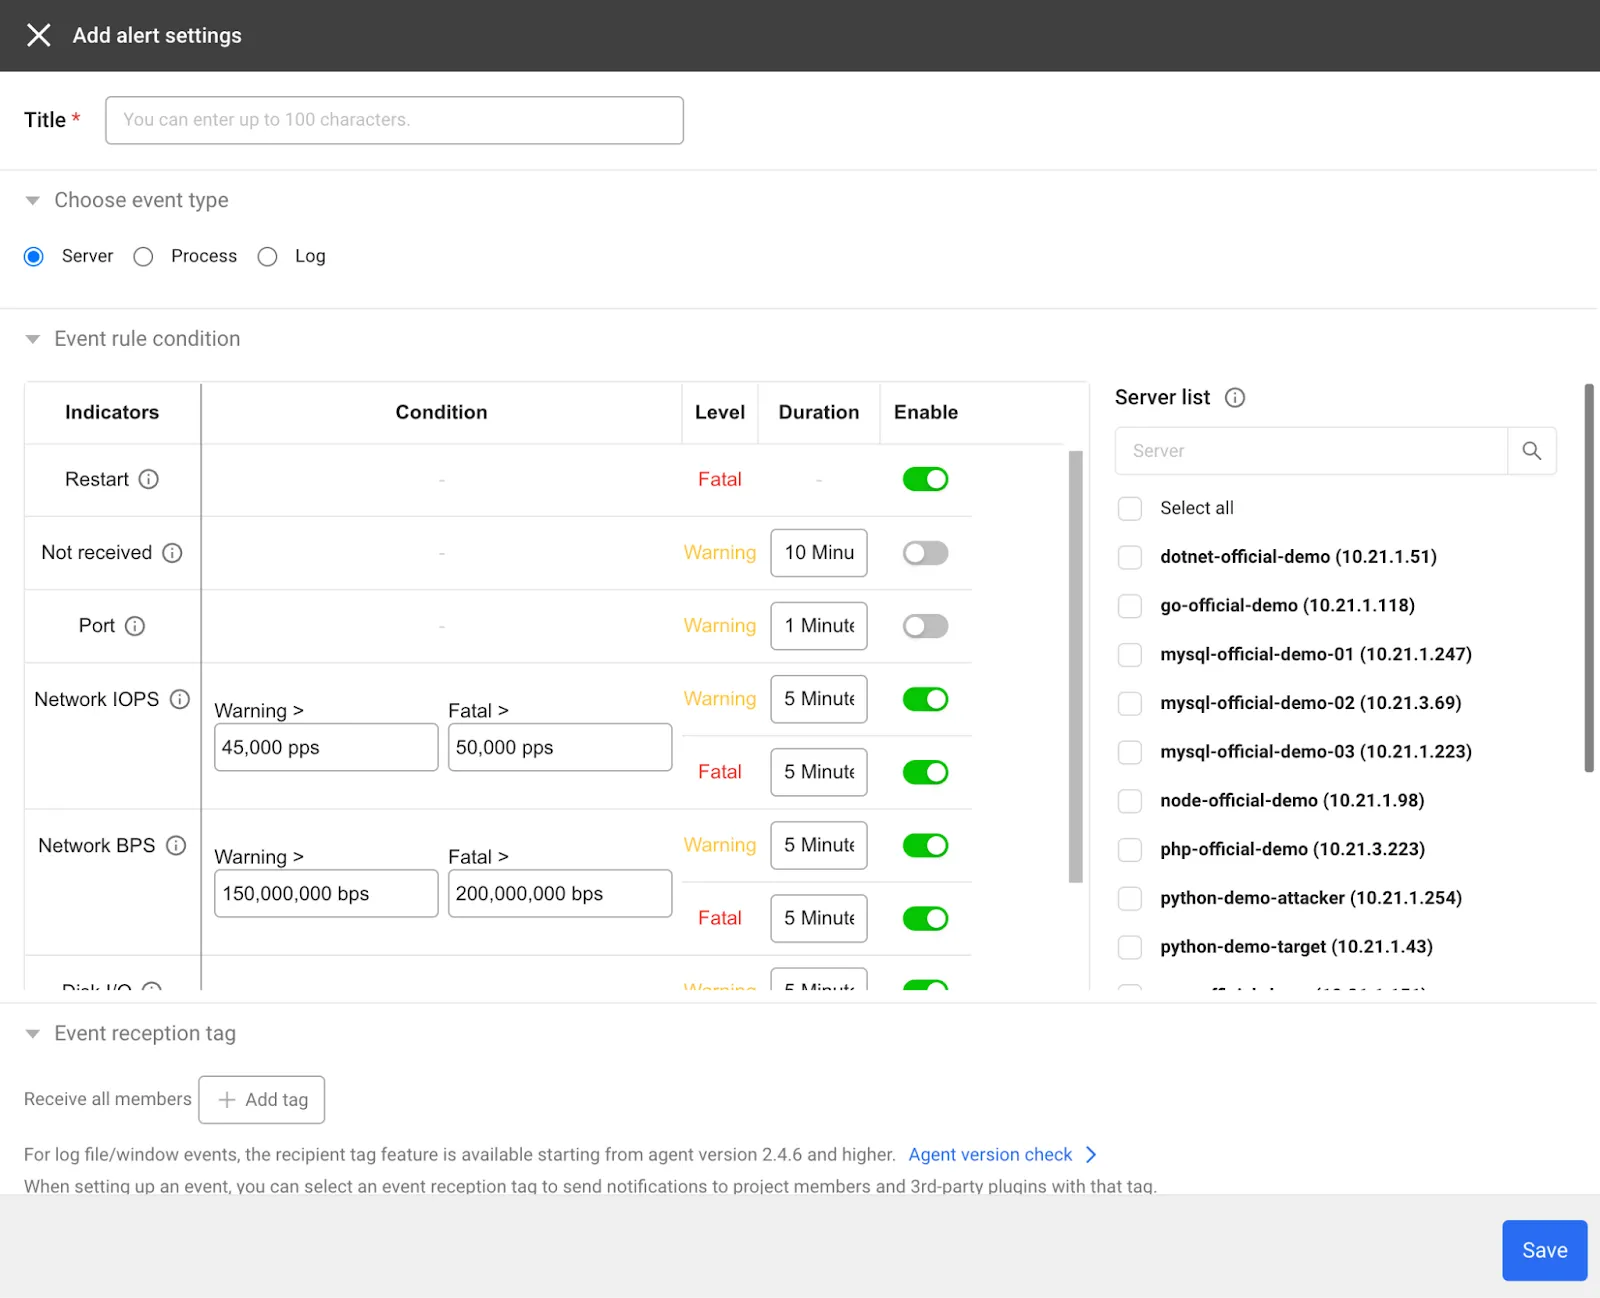
Server monitoring event details
You can customize the conditions for events (notifications) in WhaTap. In server monitoring, the event targets are server resources, processes, and log files. For example, if the CPU utilization stays between 70-80% for more than 5 minutes, a "Warning" event is raised, while a "Critical" event is raised if it stays between 81-100% for more than 10 minutes. Events are sent via email, SMS, Telegram, or other methods you specify.
Log events allow you to specify a script path to react when certain keywords are detected in a specified log file, if the situation does not require human intervention and can be automated.
Wrapping Up
In this article, we have briefly summarized the important parts of monitoring and key indicators using WhaTap Monitoring. The results of monitoring are varied, but you can mainly get results for analyzing service trends, discovering and analyzing the cause of problems, responding to them, and analyzing system performance.
If you have never used monitoring before, you can easily register a monitoring target and collect and view the desired metrics using the WhaTap SaaS service. We make it as easy as possible to view your monitoring metrics in a variety of ways, so it is a good idea to learn the basics of monitoring with WhaTap. To learn more about its features and how to set it up, check out our WhaTap Guide.
.svg)
.svg)


