.svg)
.svg)


Recently, the fields of artificial intelligence, machine learning, and deep learning have been hotly emerging in the wind of the Fourth Industrial Revolution. Among them, AlphaGo's victory over Lee Sedol 9 dan is probably the most realistic event that we can feel. I initially planned to write about what these machine learning and deep learning are, but there are many articles posted on the Internet, so I will briefly summarize the thoughts and process of applying deep learning to WhaTap.
Can we predict failures?
The first question we hear most often from customers or users is whether we cannot predict failures, or whether we can recognize and notify them. The short answer is: not yet. If you have a server that normally has a CPU utilization of 30%, and one day the CPU utilization goes up to 60%, is that a failure? The answer is vague.
Anomaly detection is easy to implement, but the thresholds are different, and there is no clear answer to the question of what constitutes a failure when an anomaly is detected. If you say, "Well, let's just set it above a certain percentage," then there is no difference between that and the traditional threshold-based approach. That is not the kind of deep learning we are after...
Deep Learning
Coming back to deep learning, the beauty of deep learning is that you can train the data you collect to make judgments. So let's say you want to train it. The data is ready. There is a huge amount of data (big data). We have a lot of data to make judgments, but not enough judgments to learn from. In other words, we do not have classified data.
The process for applying deep learning
- Collect data.
- Classify the collected data.
- Train the data to create a model.
- Attach an API and apply it to your service.

Can deep learning categorize itself?
Let me give you an example: I have been managing one server for 10 years, and I have collected and stored all the data about the behavior of the CPU, memory, etc. of the server for 10 years, and when I say learning, I do not just put in the accumulated data, but there must be a classification of the situation, such as a situation where there was a problem, an event that increased the load, or a situation where the server suddenly went down, etc.
So I have described the challenges, limitations, and how we have solved them. As I mentioned earlier, it is too time-consuming to categorize every case. It is not impossible, but what we can do at this stage is to first look for patterns that have been or could be problematic. Once you have found these patterns, you can start collecting data that is similar to them, and then categorize the data by pattern by checking whether it fits or not based on the data you have collected.
Patterns classified by deep learning
Fortunately, the advantage of providing monitoring as SaaS is that we are collecting data on a variety of customers, services, and environments, not just a specific service, so we were able to collect multiple cases per pattern. If we had tried to collect these cases from individual services, it would have been quite difficult to collect data on the various situations for a particular pattern to occur, not to mention the infrequency of problematic situations.
Deep learning at WhaTap
So let's take a look at how it was applied in practice.
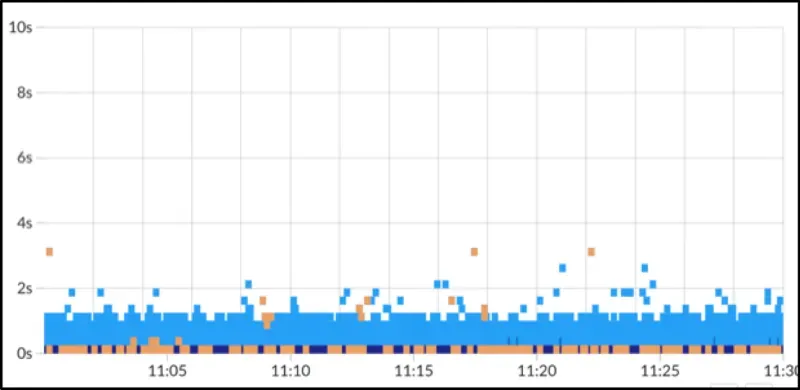
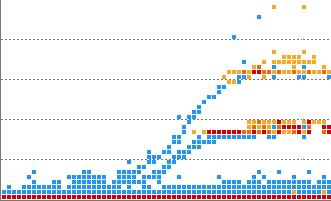
What is a heatmap
A heatmap is a response time distribution chart. The transactions that occurred in the application (WAS) are represented on the x-axis for the end time and the y-axis for the response time, and there are bands for each x and y axis. In addition, the number of transactions in each band is accumulated, and the color is darker than the accumulated number.
Common Heatmaps
Heatmap Pattern Types
Horizontal line pattern
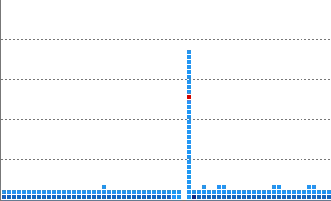
Vertical line pattern
Flying pattern
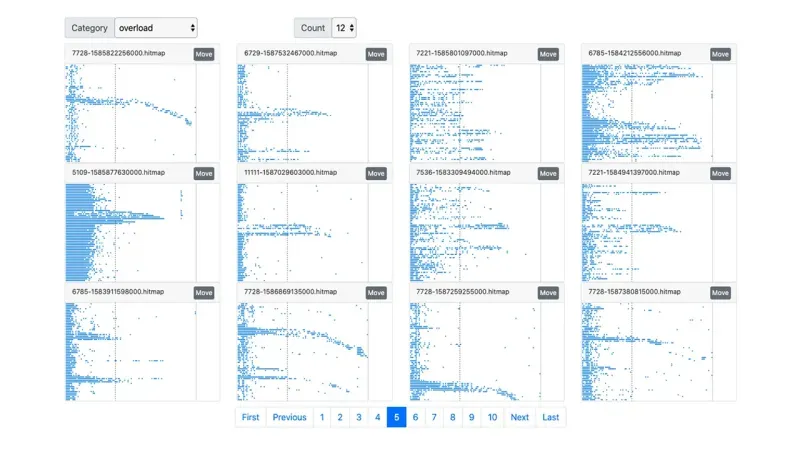
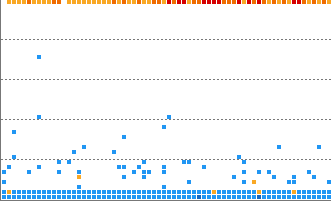
Overload patterns
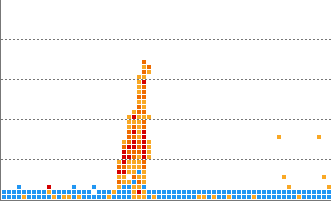
Flooding pattern

Numerous cases have been trained for each of the heatmap horizontal, vertical, flying, overload, and runaway patterns, and you can receive notifications when a pattern similar to the trained pattern occurs in real-time data.
Wrapping Up
As a developer, it was frustrating at first because even if I did a lot of research (Googling), I could hardly find any code on how to implement it or how to do it. But in the end, all I did was classify the data and train the model, and it took less than a few lines of code. Even the part that took the most time was the process of classifying the data and letting the machine do it.
Cloudification, structured as microservices, where each server or application is smaller in size but larger in number. The number of servers and applications managed by an individual is also increasing from tens to hundreds to thousands. As this number of management elements grows, monitoring will need to evolve from providing more and more diverse data to a service that allows you to see only the data you need right away and only when there is a problem.


