.svg)
.svg)


We would like to introduce the development process and usage of TopN Chart, which was created by “Sangwoo”, a front-end developer at WhaTap Labs. 🙆🏼
What can you expect to see this month?
- TopN Charts Overcome the Limitations of Series Charts!
The fatal flaw of series charts?!
Series charts are the most popular way to show how a monitored metric changes over time.
Sometimes you want to separate data of different nature within a chart with lines to compare trends, but the downside is that if you have a large number of lines to draw, it can be difficult to identify the lines that represent important changes in trend among the overlapping lines.
We could have dismissed it as unavoidable due to the nature of the chart, but the waste of resources in drawing lines that made the markings meaningless was unacceptable.
The problem arose
A client with hundreds of agents installed per project experienced a whiteout while configuring a dashboard for consolidated monitoring.
The browser was processing a huge amount of data, taking up too much CPU and not clearing the data in a timely manner, causing the browser to run out of memory and stop functioning.
We had been through a lot of trial and error in terms of how to efficiently manage time series data and chart rendering performance, so we thought, "We have got this," but when the problem arose, we realized that improving rendering efficiency was not going to solve the problem.
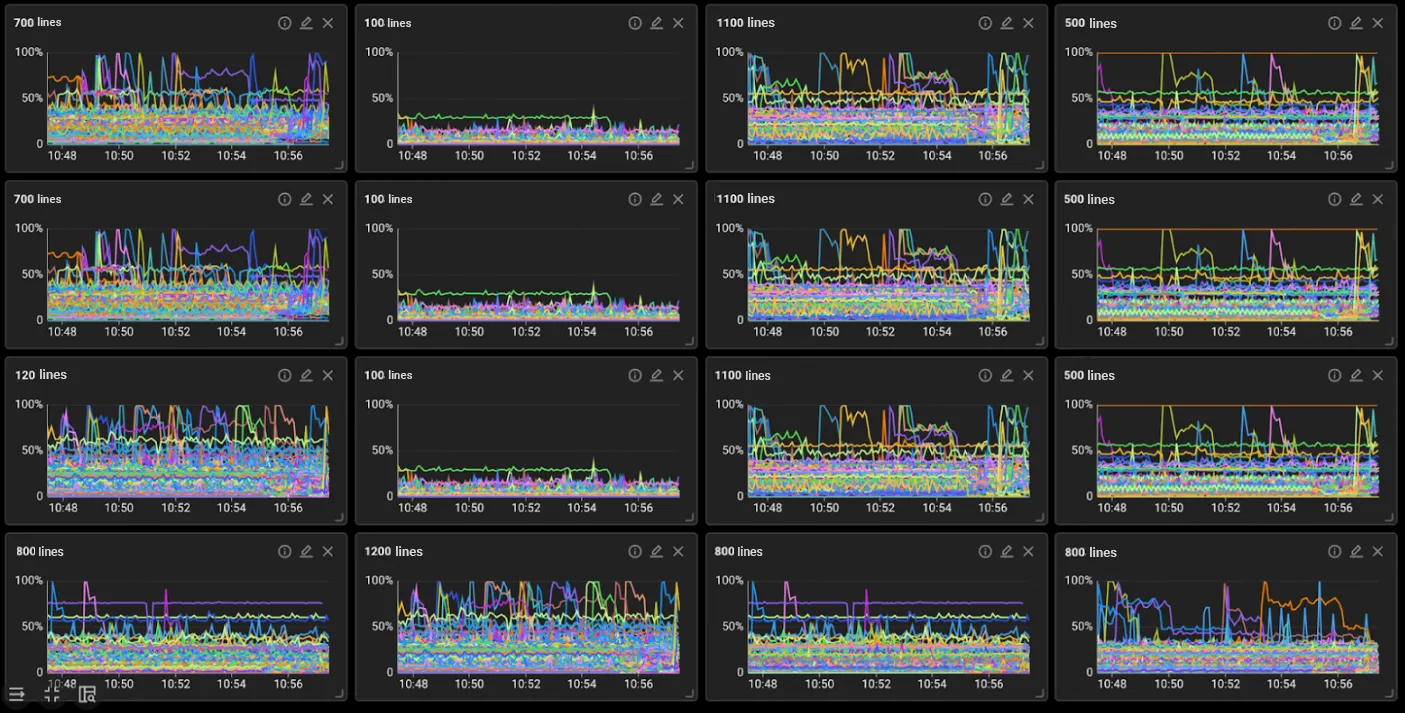
Digging a little deeper into the phenomenon, I realized that it required drawing over 10,000 lines at once. As a front-end developer, it was a moment where I felt sorry for the browser.
Eventually, I came up with the TopN series chart to solve this problem.
A TopN chart is a way to prioritize each line and display it in a chart with the top few lines.
Since 'TopN' usually uses instantaneous data with only one value for comparative sorting, I didn't think it could be related to the time series data used in series charts. At that time, CTO Sungjo Kim came up with the idea of a chart and suggested a way to combine data.
The TopN chart was born as such
How is the data fused?
- The data used by TopN Charts utilizes a matrix lookup API in the form of a query-question, internally referred to as 'MQL'. It prioritizes which lines to draw on the chart during the initial data lookup to initialize the chart, and after 2 minutes of updates.
How does it look on screen?
- Instead of keeping the traditional way of handling time series data, which updates the latest data from the last view, we decided to show in the chart when the rankings were updated so that the chart changes due to rank updates do not feel jarring.
- We added a ranking label at the top, in keeping with the concept of "parent" that distinguishes it from a regular series chart, and
- shifted the Y-axis to the right to emphasize timeliness, and tagged recent values.
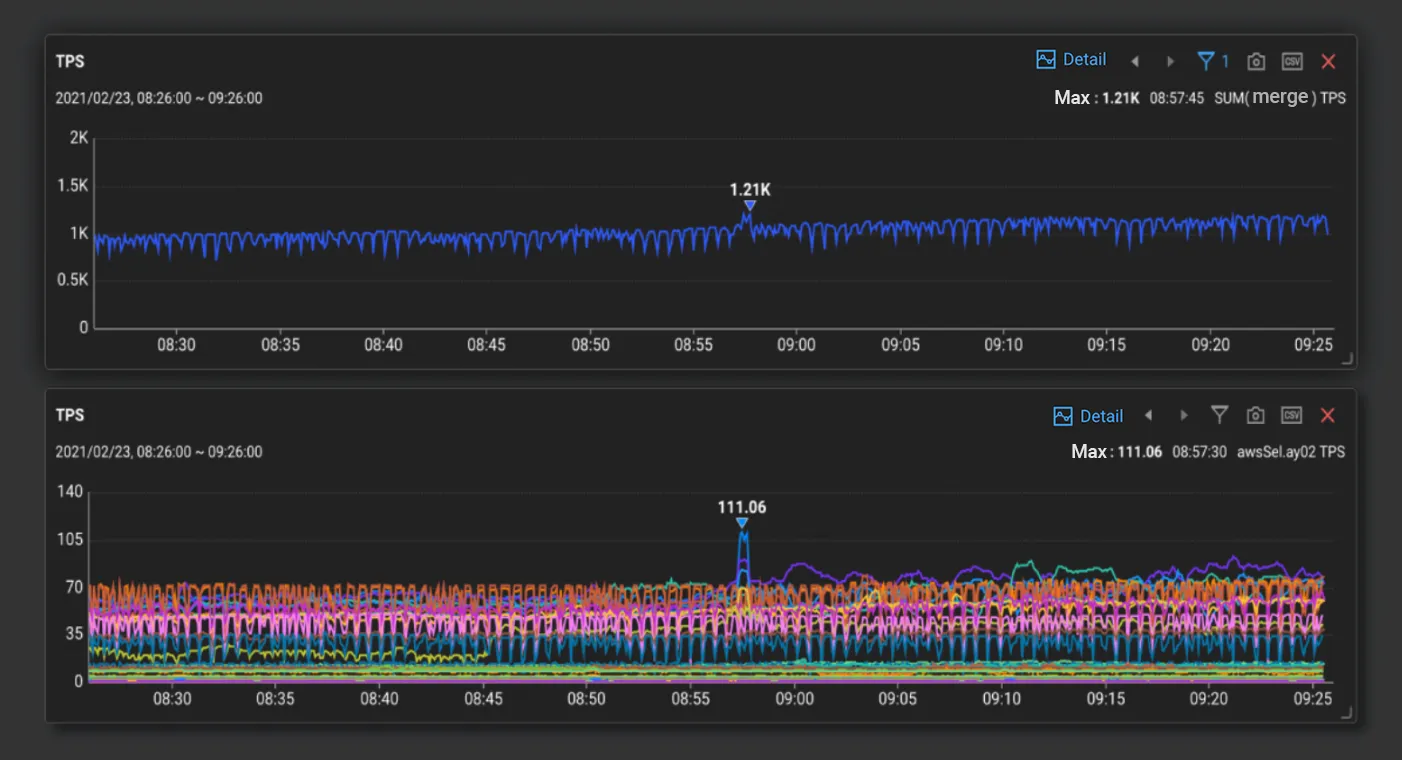
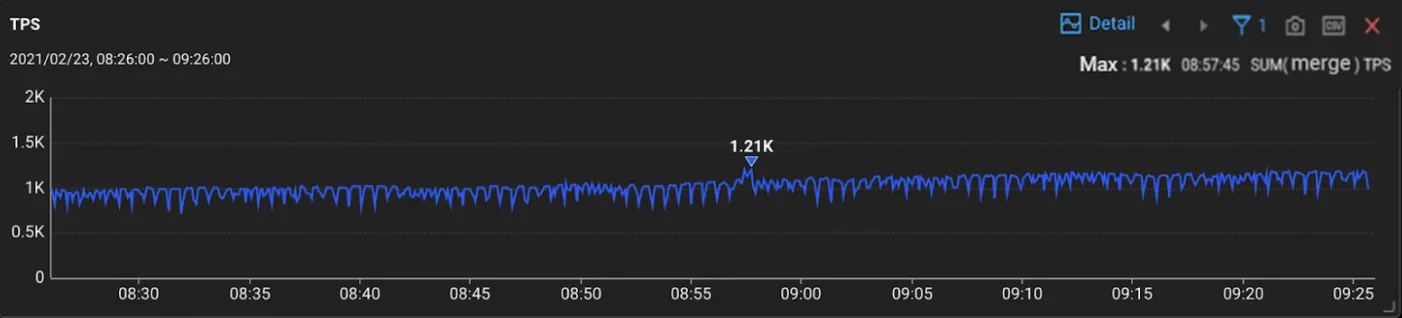
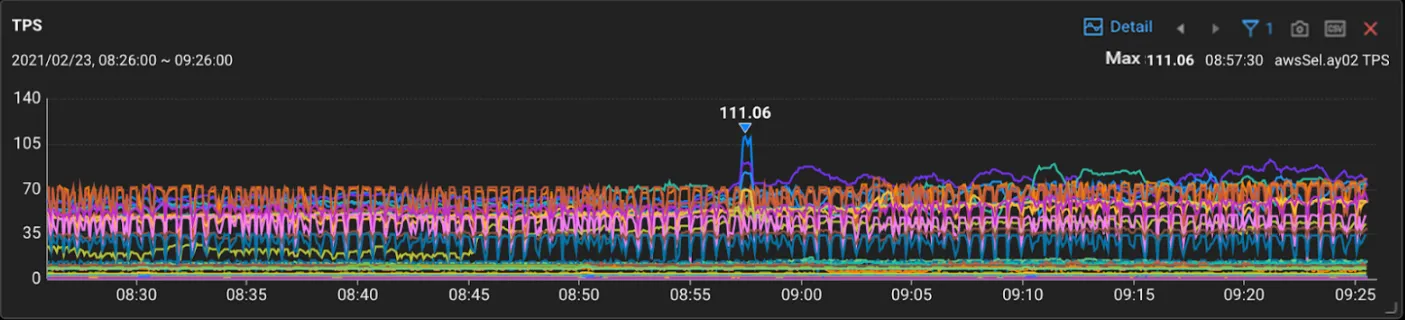
Compared to a traditional chart
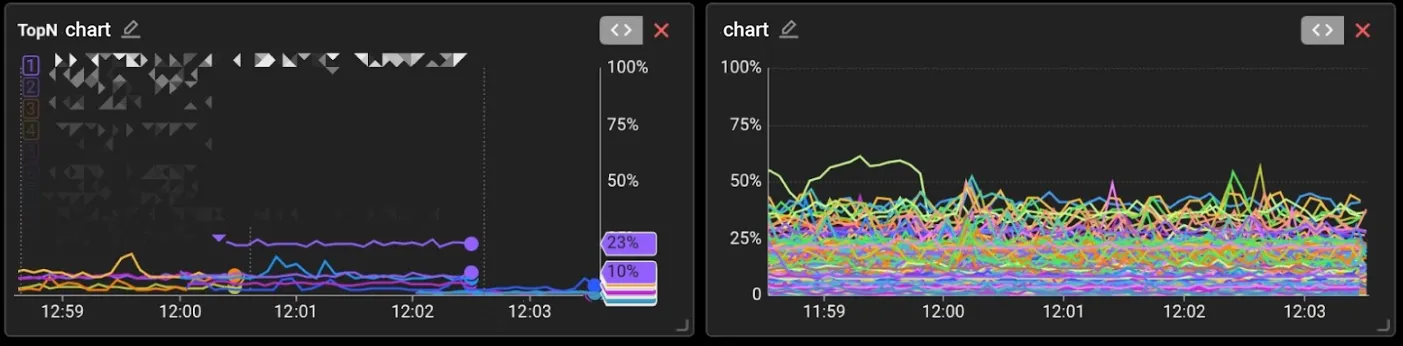
Left: TopN series chart | Right: traditional series chart
Priority is sorted by calculating the average or maximum value of the time series data over the last 30 seconds. If you have a lot of irregular trend changes or a large number of lines to plot, it is impossible to distinguish individual lines in a traditional series chart. TopN charts, on the other hand, can be represented in an identifiable form. This is especially useful for identifying lines like CPU, where the value is momentarily high and then drops back down, which is not very meaningful for analysis.As a result, I think we have improved performance and added a useful chart from an analytical point of view.
Final thoughts
TopN Charts is available as a widget in the beta version of WhaTap Flex Board. We are currently working on adding more widget types and dashboard templates to provide user-friendly dashboards and analytics services.
We welcome your feedback to make our monitoring service even more convenient! If you have any further questions or suggestions for features you would like to see, please email us at support@whatap.io.


