.svg)
.svg)


📄 What is the Reports menu?
A WhaTap report is a document that reports the status of service usage and records of failures. The person in charge of monitoring the service shares the status with the relevant departments through reports.
Analyzing monitoring data is important because it provides indicators for service improvement. However, it can be cumbersome to aggregate and document data from multiple dashboards.
WhaTap's Reports menu helps you automate your report creation tasks. Whether you need to create reports every week, share reports at a set time, or manage multiple formats, you can do it all from the Reports menu!
What are the different features available in the Reports menu?
- What are the different features available in the Reports menu?
- Download and print: Provides reports in a format that is easy to share.
- Mail: Schedule report generation. Set a periodic schedule, such as a date or day of the week. You will receive the report in the mail on the date you specify.
Real-time notification list
You can check the status of your real-time notifications in three ways
- From the Integration menu → Integration real-time notifications menu.
- After entering the project screen, you can see it via the top right notification icon.
- You can add it as a widget in your Flexboard (customizable dashboard).
We have upgraded the reports feature in WhaTap to make it even more convenient, and we are back with Integrated Reports!
🗂 What is an integrated report?
Integrated reports provide expanded functionality on existing reports by combining metrics from multiple projects. Here's what is new in the new integrated reports!
- Multi-project support With Integrated reports, you can select multiple projects and generate reports at once. In contrast, the old reports menu required you to generate a report for each project. This can be cumbersome if you have a lot of projects.
- Generate business unit reports From the Generate reports menu, you can select a project as a business unit and save it as a template. This is useful in microservice architecture (MSA) environments, where projects are typically broken up by business units.
- Optimized for large amounts of data With integrated reports, report generation time is dramatically reduced. Previously, when many services existed in a single project, it took a long time to generate reports. You can also view report results even if errors occurred during the report generation process for some projects.
- Work on other tasks while generating reports With integrated reports, you can generate reports and work on other tasks at the same time. It is okay to start generating a report and then move to another page. You can see the progress and completed reports in the list of report results. Previously, you had to wait for the report to finish generating, which was inconvenient because you could not work on other tasks at the same time.
- Share report tasks Anyone with the same project authorizations can view the reports you have created. You can see if a report has already been created. This eliminates the need to create the same report twice.
🧭 How do I use integrated reports?
You know what a great feature consolidated reports are, but you are wondering how to use them? We will walk you through it step by step!
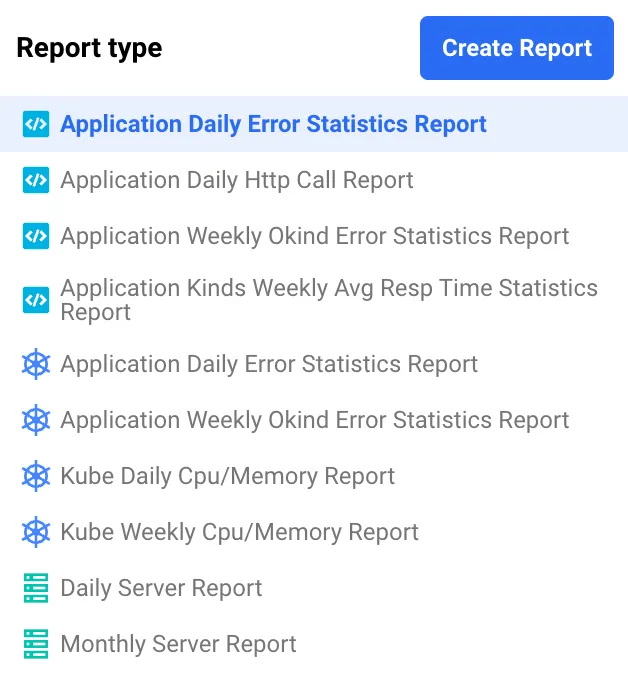
1. Select a report type
Select the type of report you want to generate from the list of report types on the left. (The icon in front of the report name indicates the project platform the report form supports)
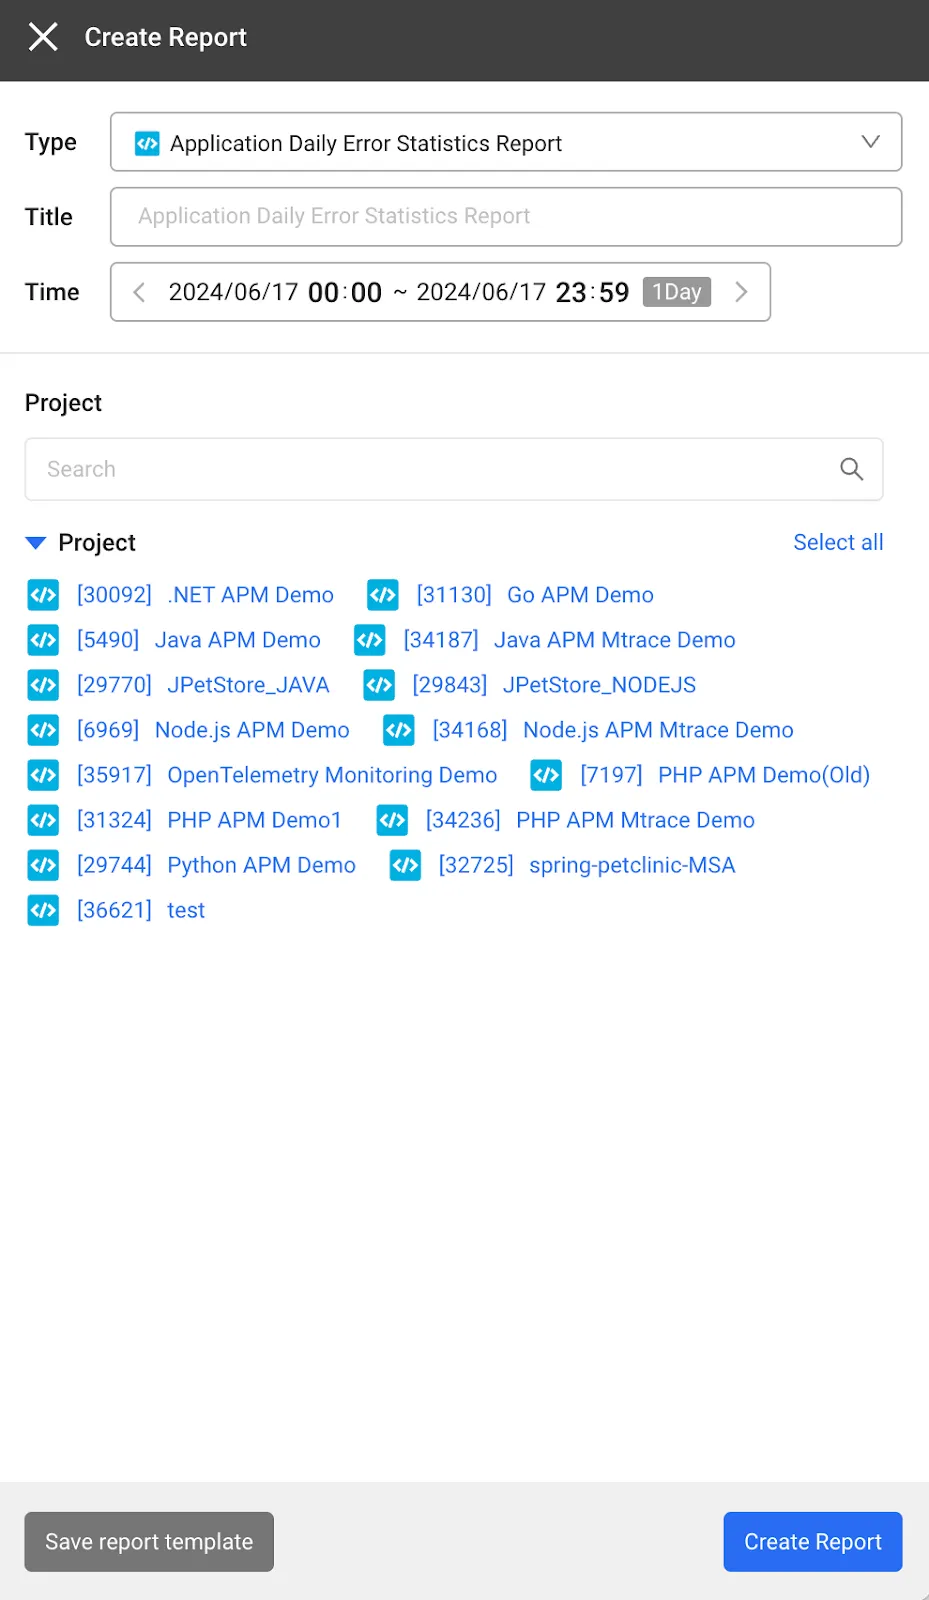
2. Select report options
You can choose detailed settings for your report
- Report name (optional): If you have multiple reports of the same type, you can name them to help distinguish the report results.
- Time: Select the time period of data to include in the report. The time period depends on the type of report (daily, weekly, monthly).
- Select projects: Select the projects for which you want to build the report. You can select by group and individual projects.
- Save, recall report form: Save the current report build settings as a template. You can recall it later from the list of report types. This is a useful feature for those who often use projects as a business unit.
Once you have entered all your settings, hit the Generate Report button!
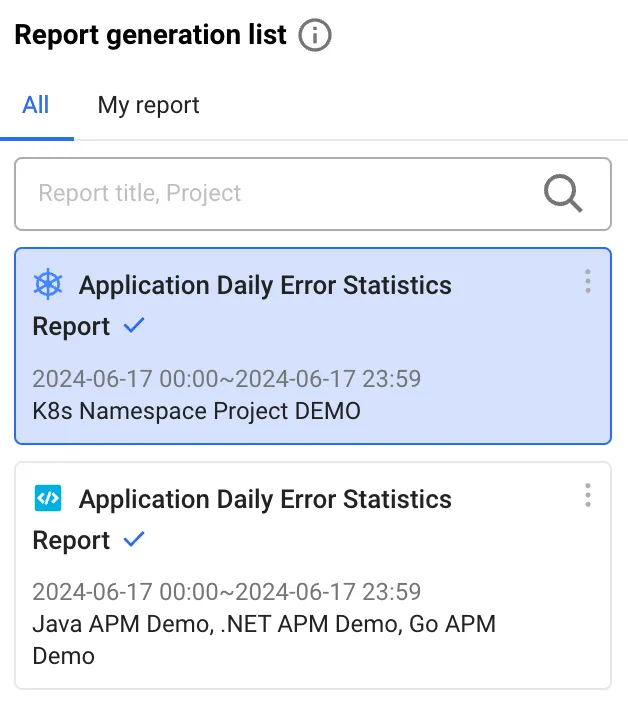
3. Check your report task list
Select the Report Tasks list to see the reports you have already created.
- Check report status: Click a report card to see how far along you are in the report task you created. You can also see any errors.
- Differentiate reports created by different people: Reports created by people with the same project authorizations as you can be labeled color-coded.
reports created by others with the same project authorization can be distinguished by label color
- Blue label: Reports created by you
- Gray label: Reports generated by someone with the same project authorization as you
Once the report status changes to Complete, you can view the results!
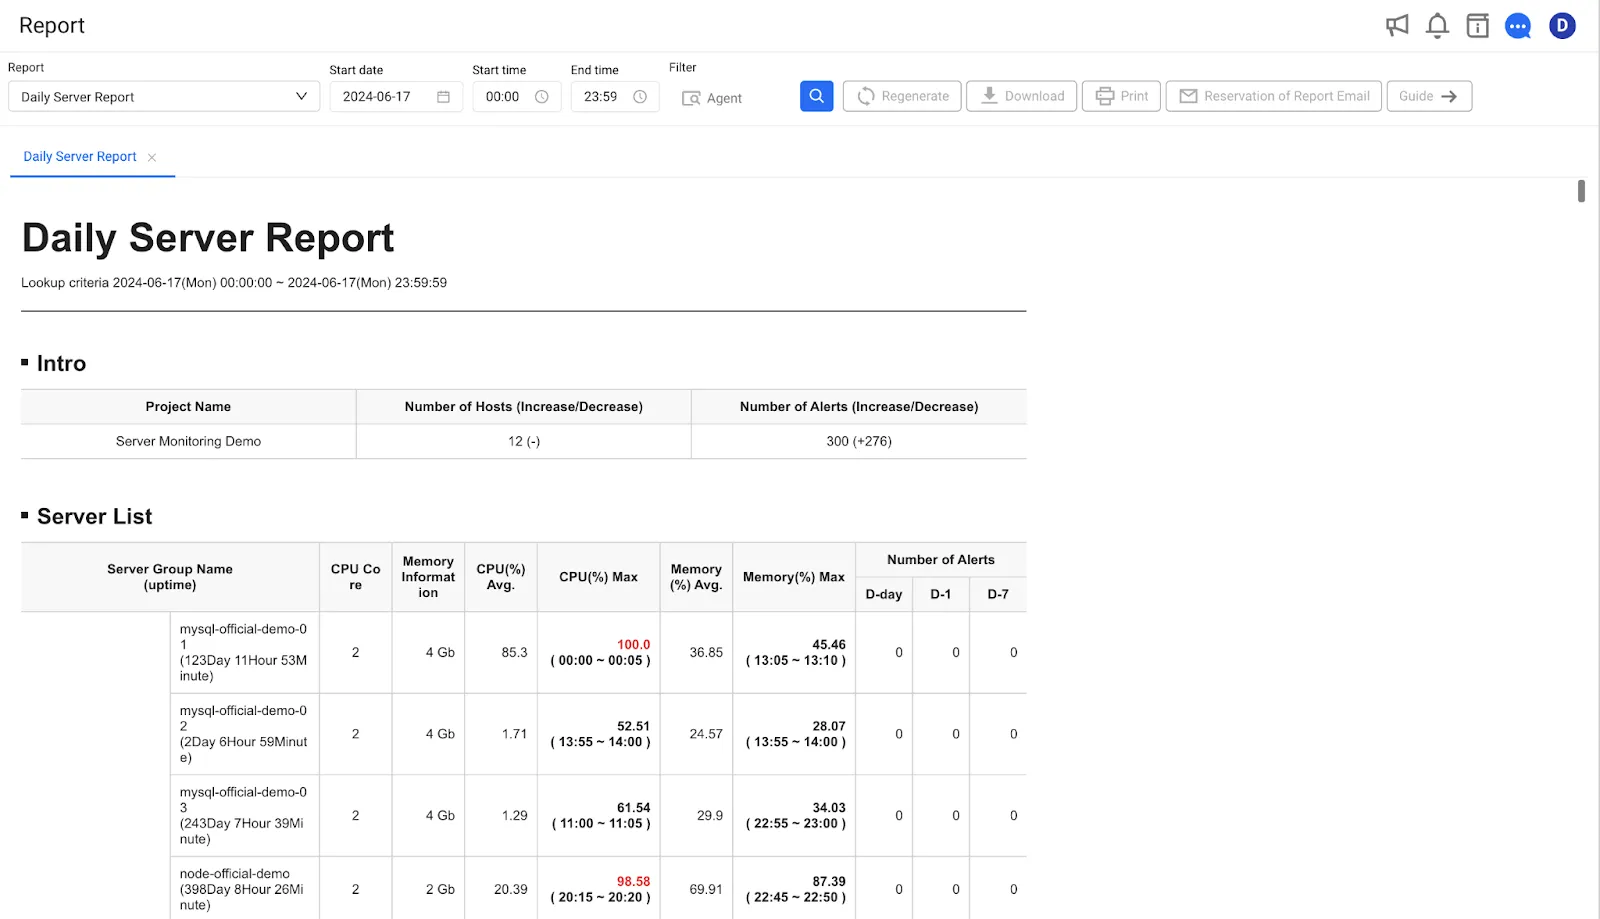
4. View and share reports
The report is available in three ways
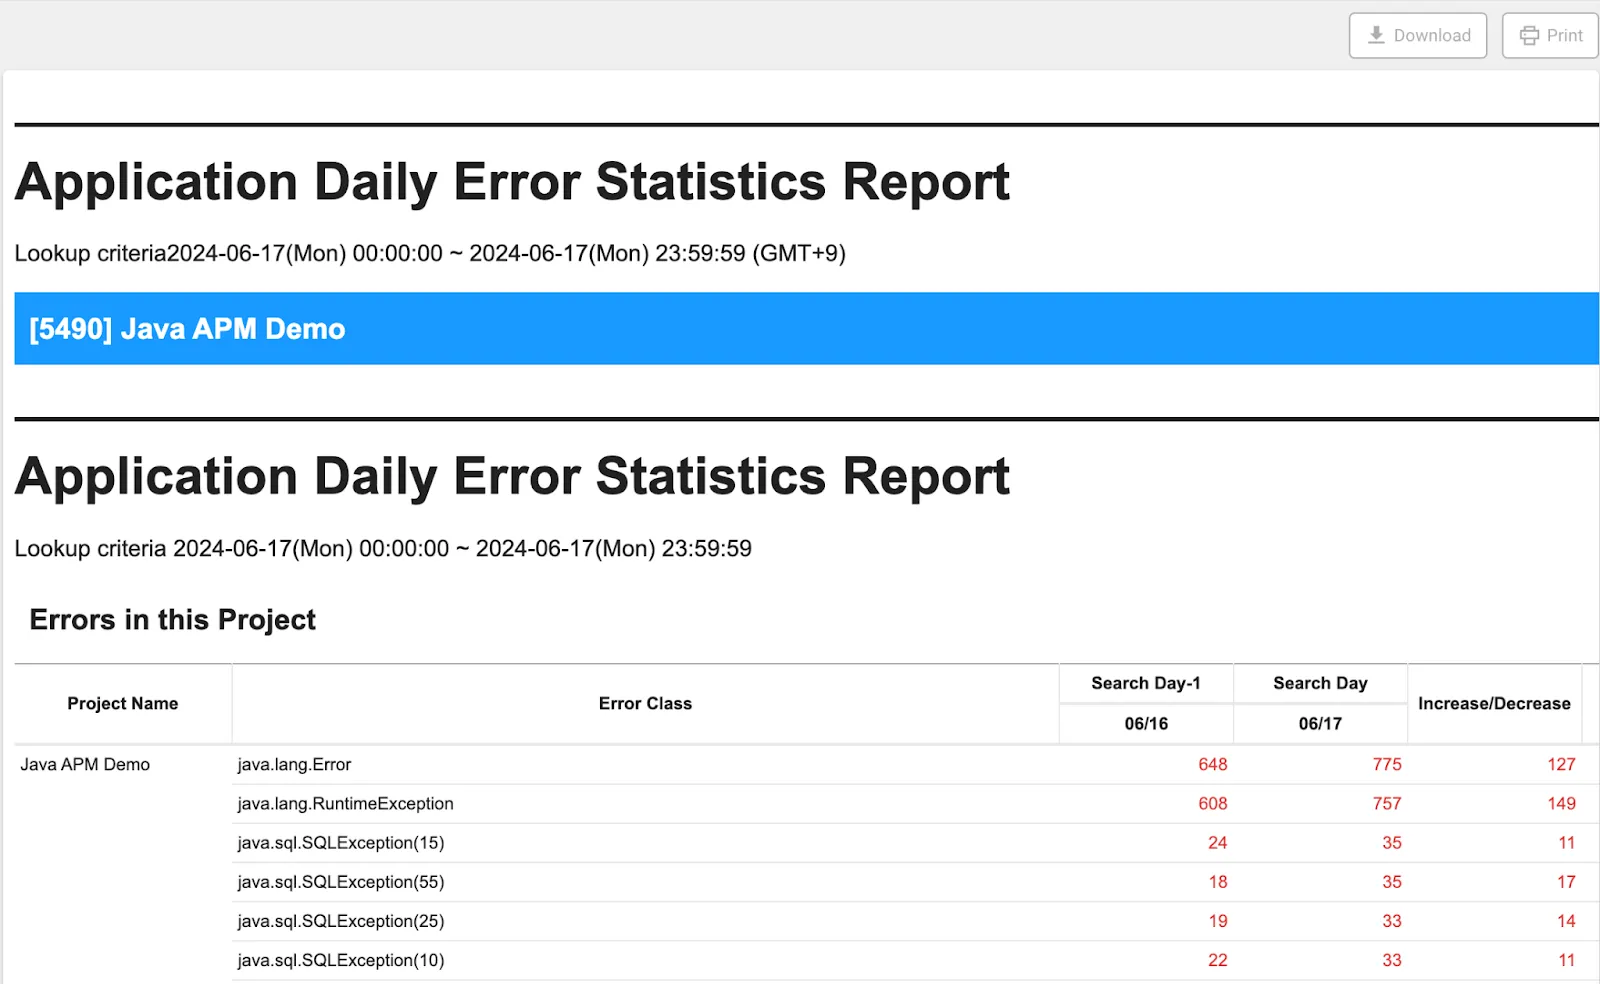
- View directly on screen: You can view it in the View results column on the right.
- Download as HTML file: Save as HTML if you want to share the report with someone who does not have authorization to manage monitoring. The same file as the report in the short view will be downloaded as HTML.
- Print and save PDFs: Press the Print button above to print the report or save it in PDF form.
What is coming in the future?
We will be adding more handy features to the Integrated Report in the future, but here is a sneak peek at what we are already looking forward to for our Monthly WhaTap subscribers!
- Support for multi-platform forms Right now, you can only select a single platform project per report. In the future, we will be adding a form that allows you to use multiple platforms together. We are working on collecting data from servers, applications, database analytics, and more to make your analysis more informative!
- Emailing support We are planning to add the ability to email reports when they are done generating. Wouldn't it be great if you could check your email to see if your report is done?


