.svg)
.svg)


This month's webinar from WhaTap Labs is "Monitoring Basics from the SaaS Monitoring Masters, WhaTap".
1. Definition of monitoring
"to watch and check a situation carefully for a period of time in order to discover something about it"
The dictionary definition of monitoring is the act of carefully watching and checking a situation in order to discover something about it. For IT services, monitoring means the act of observing and checking elements of an IT service to discover failures and errors.
2. Why do we need to monitor?
The purpose of monitoring is to recognize and prevent failures or errors, so that we can provide reliable services. But what do we mean by failures? On what basis should we distinguish between stable and unstable services?
3. What if I want to manage failures and stability?
If you want to manage failures, you need to define the criteria for failure and stability correctly. The same goes for stability. You need to have criteria for unsafe situations so you can manage them.
To manage failures, you might have internal management criteria in place. Typically, we look at resource usage, such as CPU usage or file system usage. Sometimes, when resources are used above a threshold, we use that as a criterion for near failure or unreliability. I would argue that this is the wrong failure threshold.
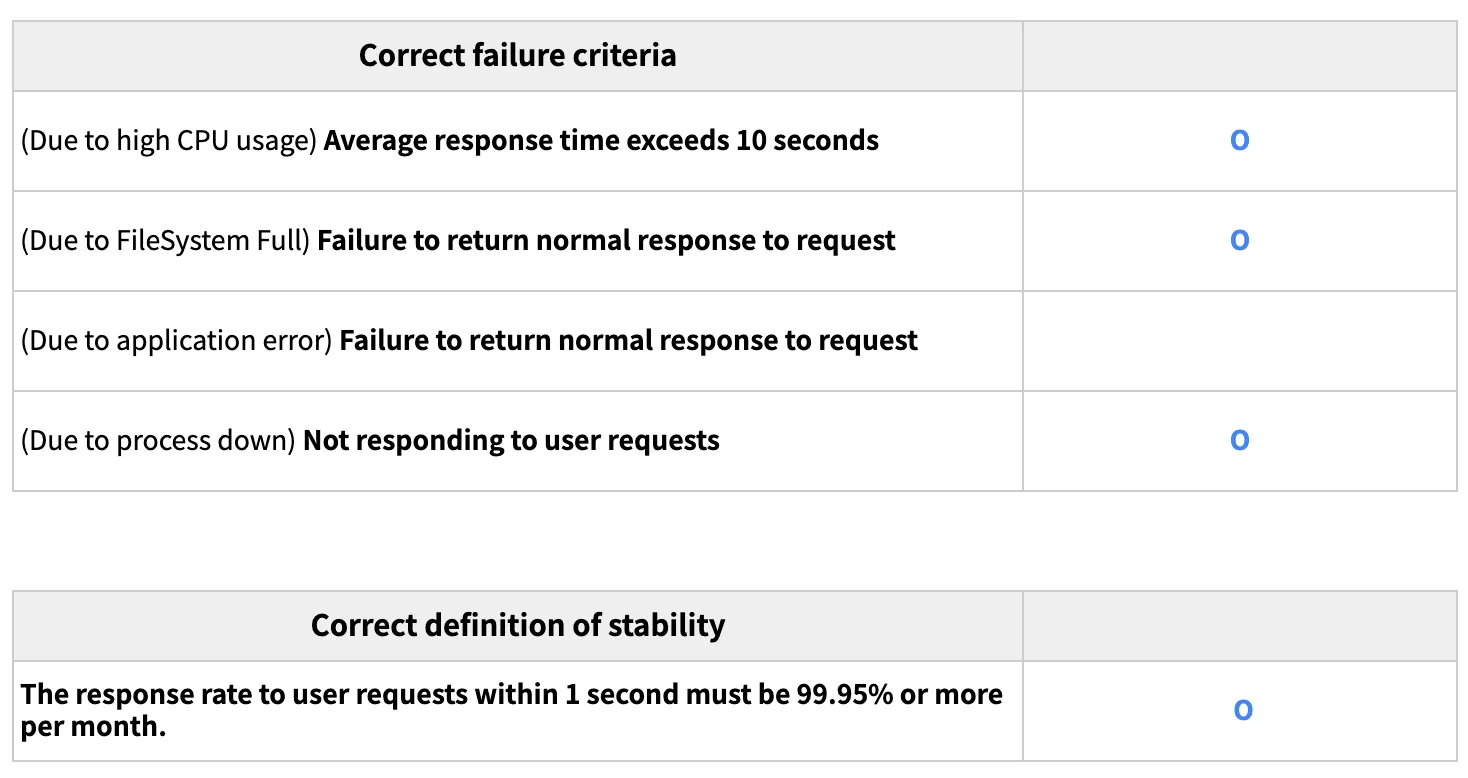
How should the right failure criteria be defined? You might consider a failure to be when the average response time exceeds 10 seconds, or when it fails to return a response to a request normally.
In other words, the criterion for failure is whether or not the user feels inconvenienced in the process of using the service. Once you have established the right baseline for failure, you need to define reliability. It is unrealistic to expect any service to operate without a single failure for an entire year, so when you define reliability, you are aiming for a certain percentage of user requests to be responded to within a few seconds or less over a certain period of time. With the right baseline for failure and reliability, you can set service goals, then monitor and manage them.
In this process, it is essential to clearly distinguish and recognize failures, failure phenomenon, and failure causes.
Failure vs. Failure phenomenon vs. Failure cause
- Failure: The inability of a service to respond normally to user requests
- Failure phenomenon
- Delayed response due to spikes in CPU usage
- Unresponsive due to process down
- Cause of failure
- CPU usage spikes
- Excessive memory usage due to certain application logic errors, frequent GCs due to running out of memory
- Unresponsiveness due to process down
- Process Down due to Application Memory Access Violation
- Fail-Over takes 3 minutes
- Process Down due to Application Memory Access Violation
- CPU usage spikes
4. What do I need to monitor?
You need to monitor all three: the failure, the failure phenomenon, and the cause of the failure.
- Metrics to recognize failures APDEX, TPS, Average Response Time
- Indicators of failure Resource usage (CPU, Memory, Network resources, etc.), Port open, Process down, etc.
- Information needed to analyze the cause of the failure Logs, detailed resource usage information, and Stack information
5. Who will monitor?
Monitoring should be done by tools, not people. There are so many things that can cause failures and unreliability, and it is impossible for a human to keep an eye on all these metrics 24/7.
So what is a human to do when monitoring is left to a tool? Humans perform the act of outsourcing monitoring to tools. Tools allow you to be alerted when anomalies are found, which means you manage the alerts, track down the root cause, and take action.
6. How do I monitor?
Monitoring consists of three main steps. Defining your service goal level, identifying obstacles to achieving your goal level, and remediating the causes of those obstacles.
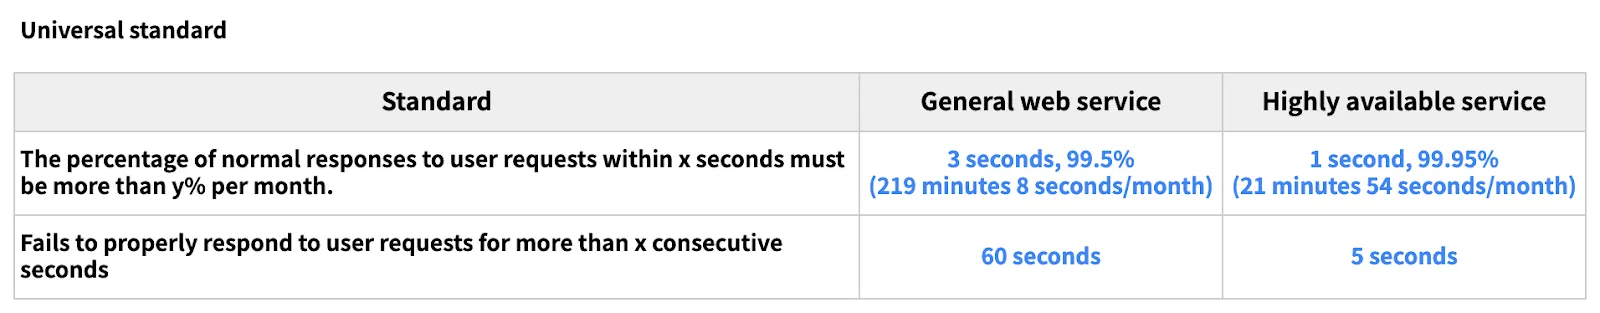
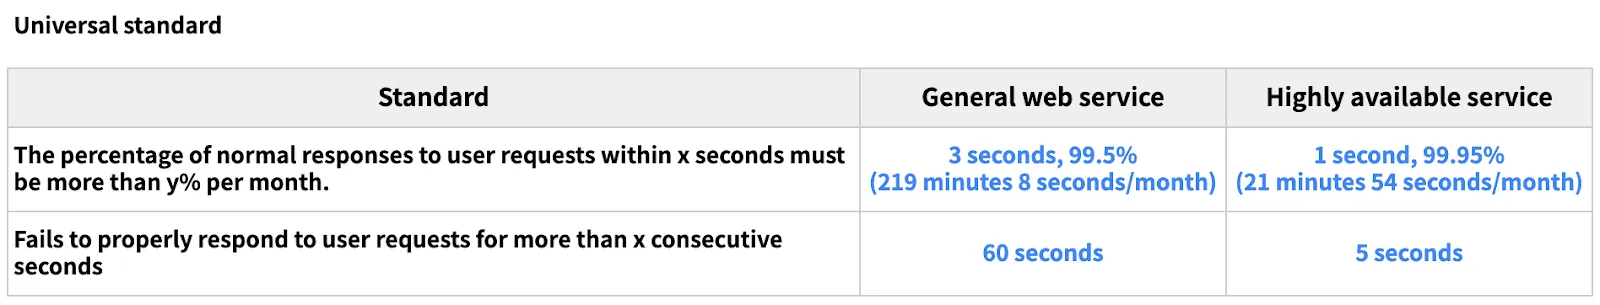
Step 1 - Define my service goal level.

A general rule of thumb is that a typical service should respond to user requests within 3 seconds or less 99.5% of the time, every month. In a month, that is about 3 hours and 40 minutes*.
If you have a highly available service, your target will be different. You might want to spend about 20 minutes of downtime per month. To achieve this, you need to have good service redundancy, fail-over, and staffing in place to handle issues as soon as they are recognized. If you are running a small, SMB operation, I do not recommend aiming for 99.95% uptime, because realistically, you are not going to get there. I recommend defining your goal around 99.5%.
Considerations should be based on system and staffing limitations. Also, when defining service goals, keep the criteria as simple as possible. It is never too late to add additional criteria after the service has matured.
Step 2 - Identify obstacles to achieving the target level.
There are a number of things that could be getting in the way. Maybe queries are slowing down, or maybe your user influx itself is peaking at certain times of day, causing a delay in response time. You will need to find the most likely culprits and start eliminating them one by one, starting with the highest priority. If you are using a monitoring tool, you can utilize alert occurrence history or transaction statistics.
Step 3 - Remediate the cause of the interruption.
Fix program errors, redistribute server resources, and remediate the cause of the perceived obstruction.
At this stage, you must distinguish between the phenomenon and the cause.
- Example 1) Phenomenon: High CPU usage
- Cause: Which process? Where is the application source?
- Example 2) Symptom: A process is down
- Cause: Information before and after the crash → Analyze through information
7. Why you need to monitor correctly
It is very important to identify the exact cause of a failure, otherwise it makes things difficult for the person in charge and often costs money. For example, let's say you're experiencing a high CPU usage failure. To identify the exact cause, you need to analyze or fix the error logic. But what if you do not have enough people to do that? The next best thing is to add more servers because you are running out of resources. While this may solve the immediate problem, the same problem can happen again at any time in the future.
8. Benefits of using WhaTap
I would say there are three main things.
They are: ease of installation, effective notification policies, and the ability to help you analyze failures accurately.
First, the application itself is easy and straightforward.
All you need to do is sign up and install the agent. It is easy to install with just a few lines of commands, so it is a no-brainer.
You could also consider open source. However, if you have to jump through hoops to get to open source, it might not be as efficient. Why not let the tool do the monitoring, and use the time you save to focus on more important business?
Second, you can set up alerts efficiently.
No more trial and error to figure out what conditions to set alerts for. If you do not set alerts appropriately, you can get overwhelmed with notifications and get tired or miss important failures.
WhaTap provides the most commonly used notification policies by default. There are also different ways to receive notifications. Once you have registered your contacts and turned on your alarm, you can receive notifications via SMS, email, messenger, and more.
Finally, you can get help analyzing failures accurately.
It is really important to analyze failures accurately when they occur. However, in some cases, it can be difficult to spend a lot of time analyzing.
At WhaTap, we collect information for analysis, so most issues can be analyzed using our tools. However, how you analyze the data may vary depending on your capabilities.
If you need help, please contact WhaTap Labs online customer support. Our experienced WhaTap consultants can provide you with a fresh perspective.
Did you find this article, Out-of-the-Box Monitoring for Dummies, helpful?
For Part 2 - Introducing the metrics to look out for in the monitoring screen, check out the [WhaTap Labs Webinar] Getting Started with Monitoring for Novices on YouTube 😉 😉 .


