.svg)
.svg)


Introduction
To protect your precious vacation, WhaTap has machine learning that analyzes failure patterns and alerts you. Its name is hidden real feature! Introducing WhaTap's hidden real feature! 😊😊
What is a hitmap?
A hitmap is a chart that shows the response time distribution of application transactions. Hitmaps are designed to help users analyze application performance by providing an intuitive representation of the response times, frequency, and errors of large transactions.
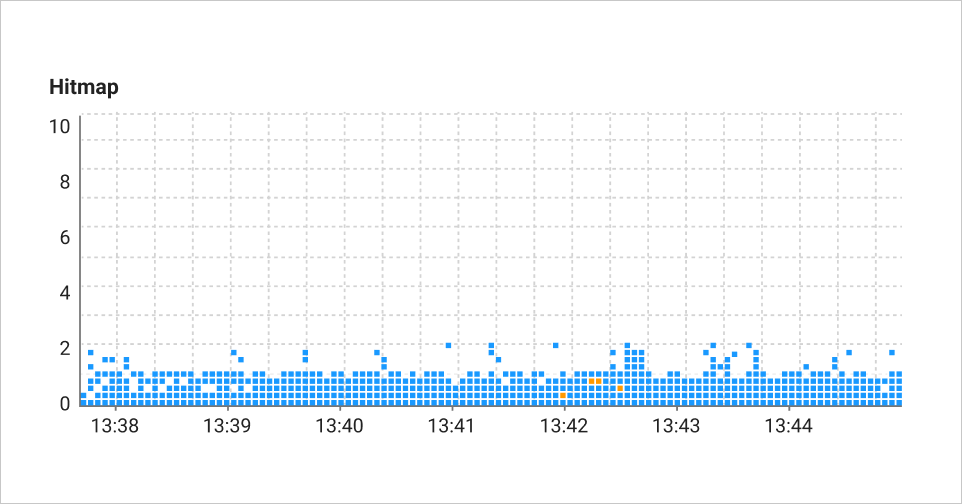
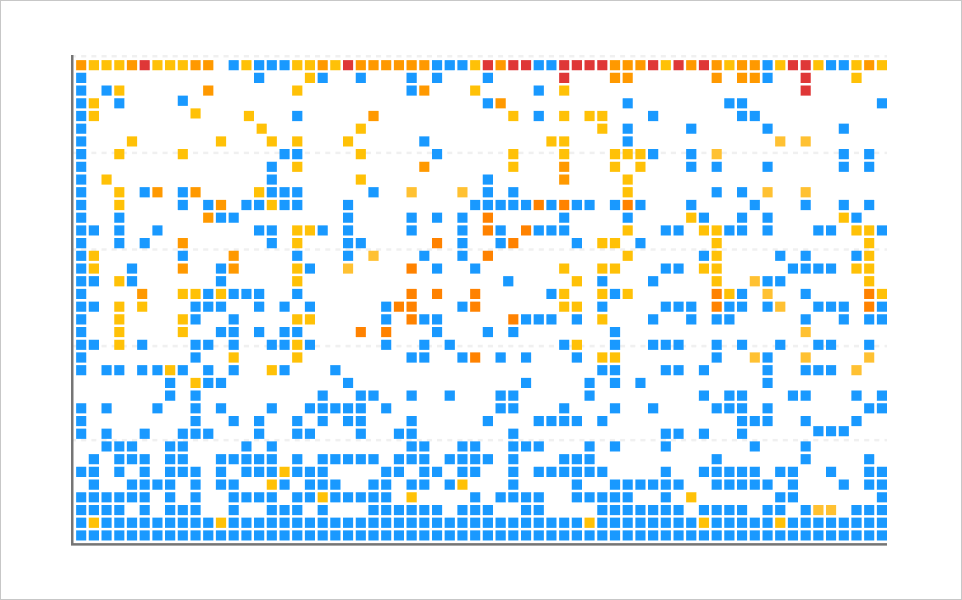
Hitmap dashboard screen in WhaTap
In the graph, the vertical axis is the transaction response time and the horizontal axis is the transaction end time. Transactions are represented by small squares, with a darker blue color indicating a higher frequency of that transaction, and if the color changes to orange or red, you can identify a problem with the transaction.
Hitmaps, analyze with patterns,
When your application is running normally, it is common for transactions to terminate normally within a few seconds. As shown in the photo above, the hitmap shows a clustering of healthy transactions in blue in the 2-second window.
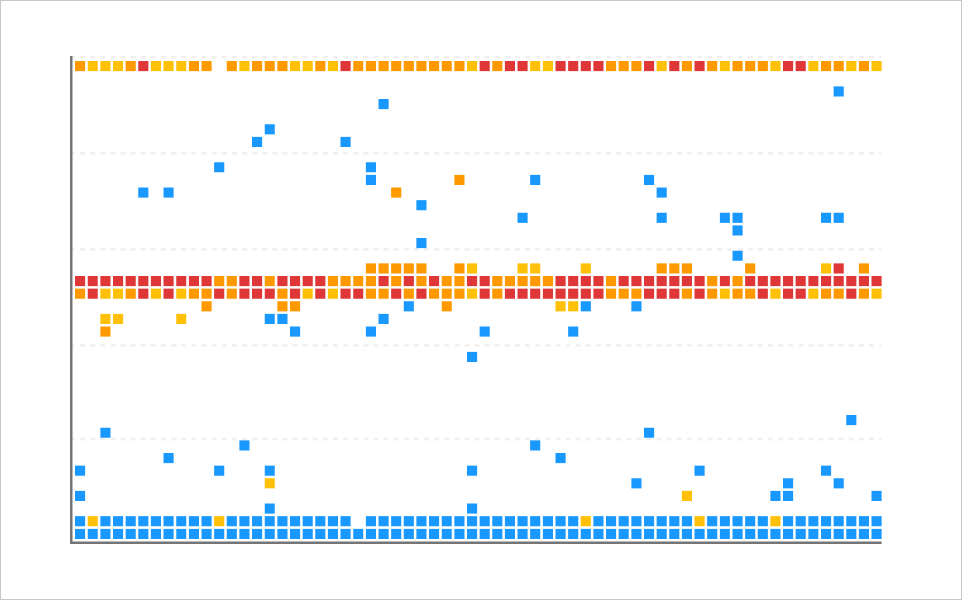
On the other hand, the bottlenecks in your application are revealed by the hitmap pattern. If the shape of the hitmap shows a "pattern" that is not monotonous, it can be interpreted as a sign of a problem in the application. Rather than trying to find the offending transaction in a list of transactions, reading the shape of the hitmap can help you understand the problem more intuitively.
In particular, the transaction that is causing the problem might not actually be the one with the high response time or error, and there is context that can't be determined from a simple list UI, so it is useful to look at the entire transaction picture with a hitmap.
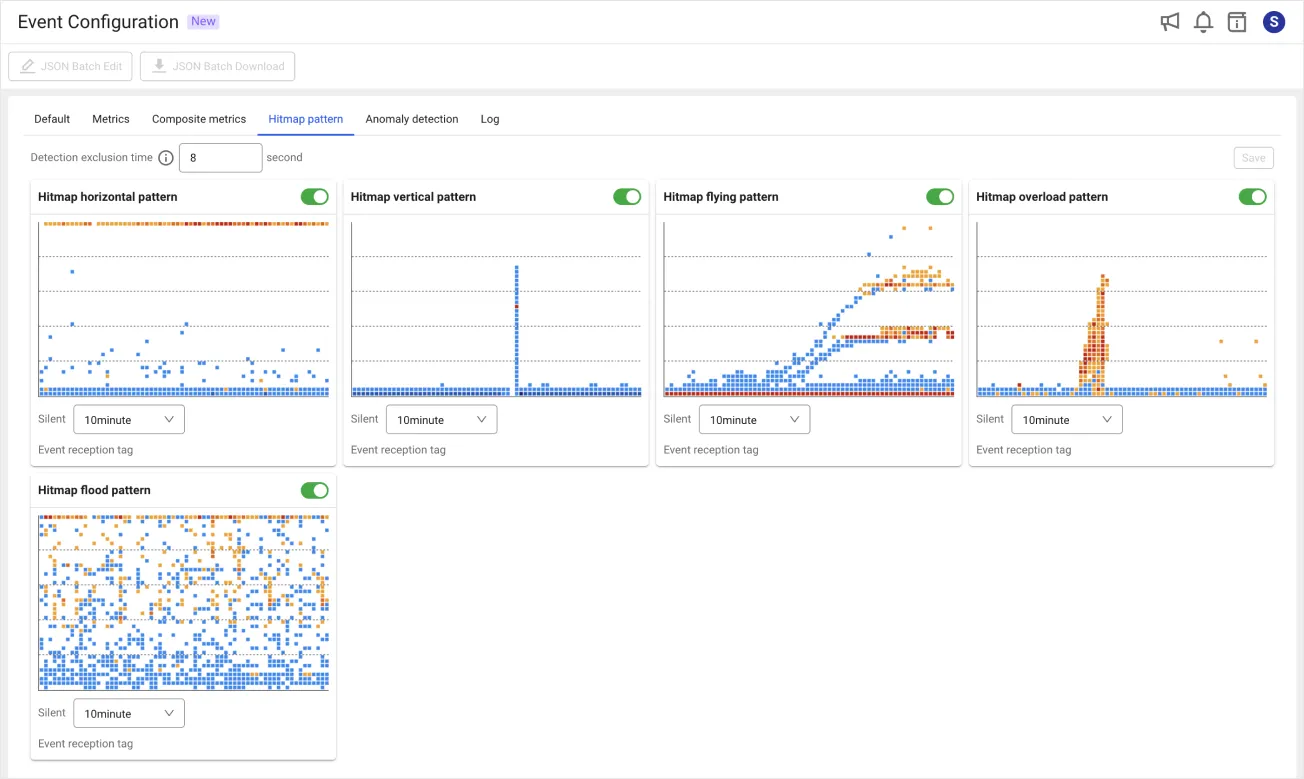
What are some hitmap patterns?
The first is a pattern where a vertical line appears temporarily . When a temporary lock occurs during transaction processing, transactions are queued for processing. When the lock is resolved, the transactions waiting to be processed end at once, at similar times. This creates a vertical line.
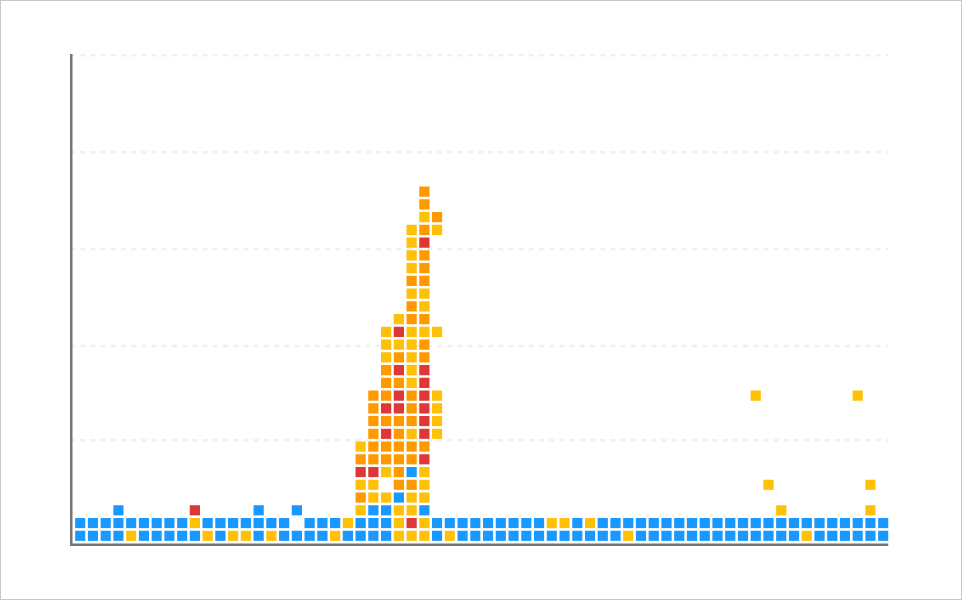
The second is the pattern where horizontal lines appear . For example, in a 10-second timeout condition, many transactions will wait 10 seconds and then get a timeout error if they run out of resources. This will cause a horizontal line around the 10-second mark on the hitmap. If you have logic to retry after the timeout, the horizontal line will repeat in 10-second increments, as shown.
A flying pattern that looks like waves is a pattern that appears at intervals due to a common resource shortage, such as a specific resource or log.
An overload pattern is a pattern that appears when there is a high volume of transactions at once that temporarily causes problems with all or some responses.
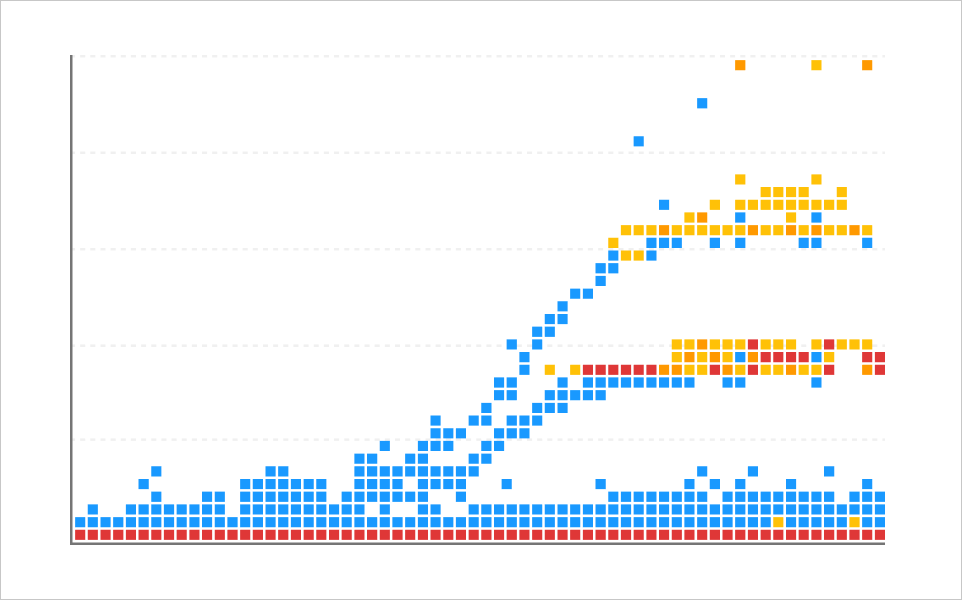
A flooding pattern is a pattern of overall increase in response time during times of excessive transaction requests or load.
WhaTap hitmap patterns machine learning learns
Hitmap patterns are a useful way to analyze, but it is hard to keep an eye on them all the time. At WhaTap, we combine hitmaps with machine learning technology to make monitoring more convenient and useful.
Hitmap pattern notifications help development and operations teams understand what is going wrong with their applications and transactions without the need for specialized monitoring staff.
Based on hundreds of terabytes (TB) of hitmap data that we collect in real time, we analyze hitmap patterns in your projects and alert you to issues when the program detects anomalous patterns.
How to set up hitmap pattern alerts
Hitmap pattern notifications are available in the application monitoring project.
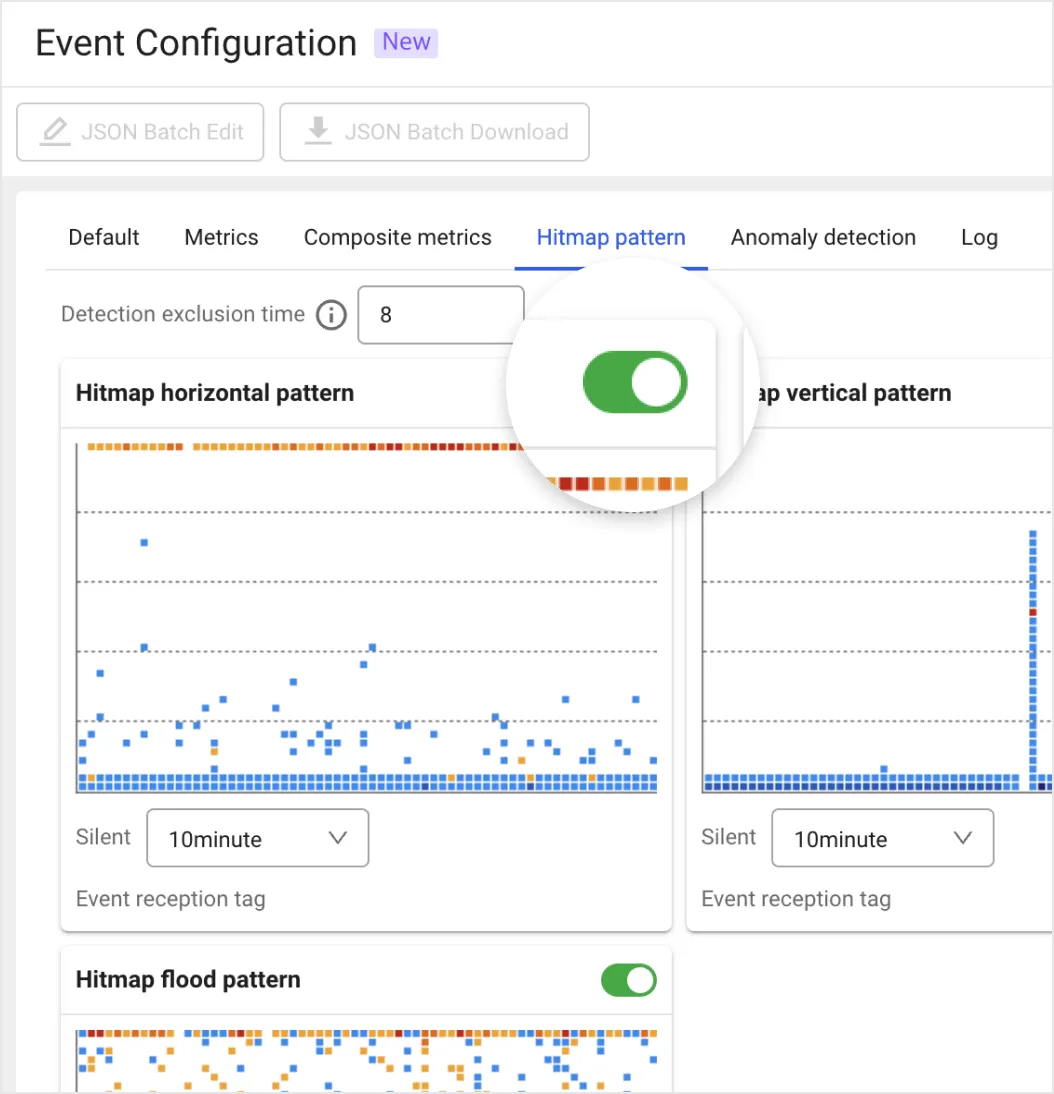
① Click [Alert notifications] → [Event settings] on the application monitoring main screen.
② Hitmap pattern notifications can turn events on or off depending on the type of anomaly pattern. In [Event settings], click [Hitmap pattern] and then click the Enable button on the pattern. You can check the activated notifications through the notification channel you set.
For example, if you are using application monitoring and you get a flooding pattern alert, that means your response times are increasing overall, right? You will be able to take a look at the transactions across the board and find a solution.
Now you can set up smart, machine learning-based alerts to help you quickly understand what is going on, even if you are not in your application monitoring screen!


